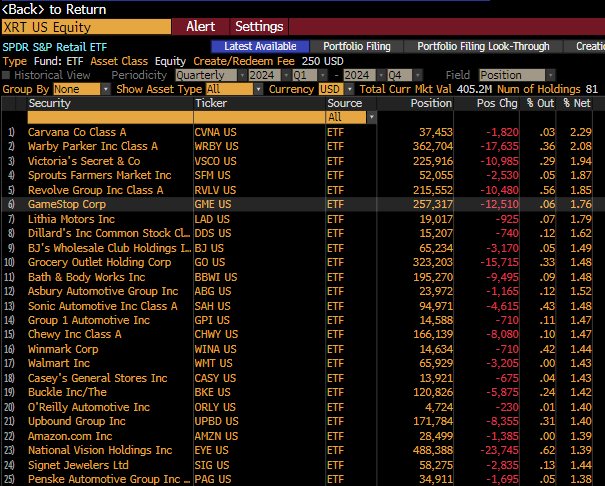
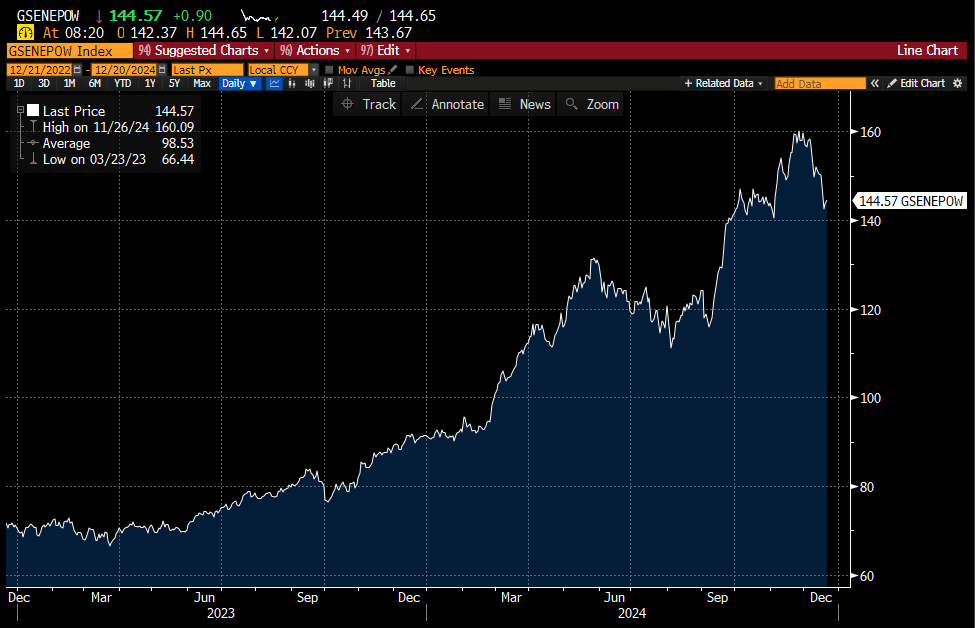
Power Demand/ US Government Issuance/ Equity Allocation levels
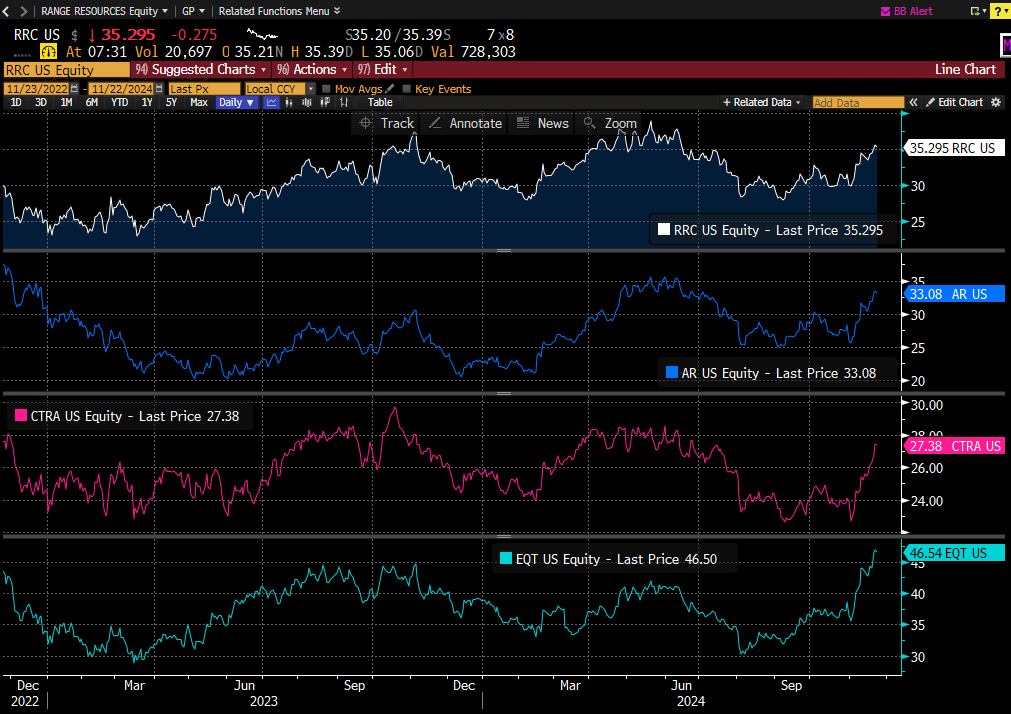
Power Demand
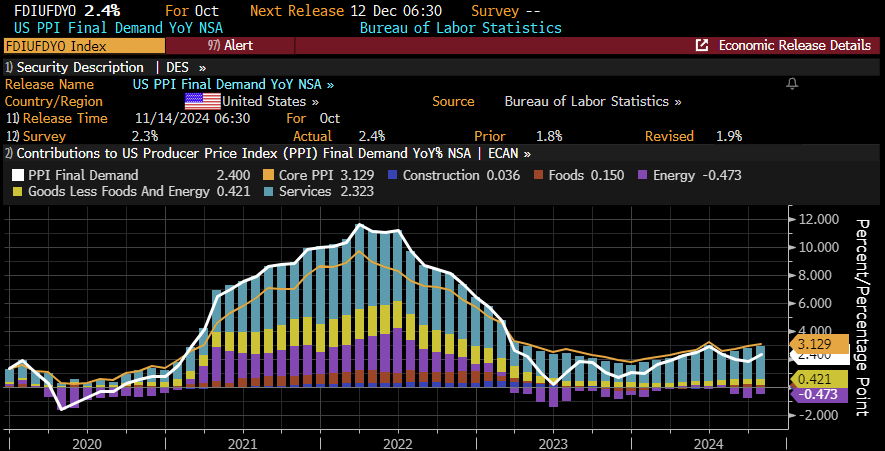
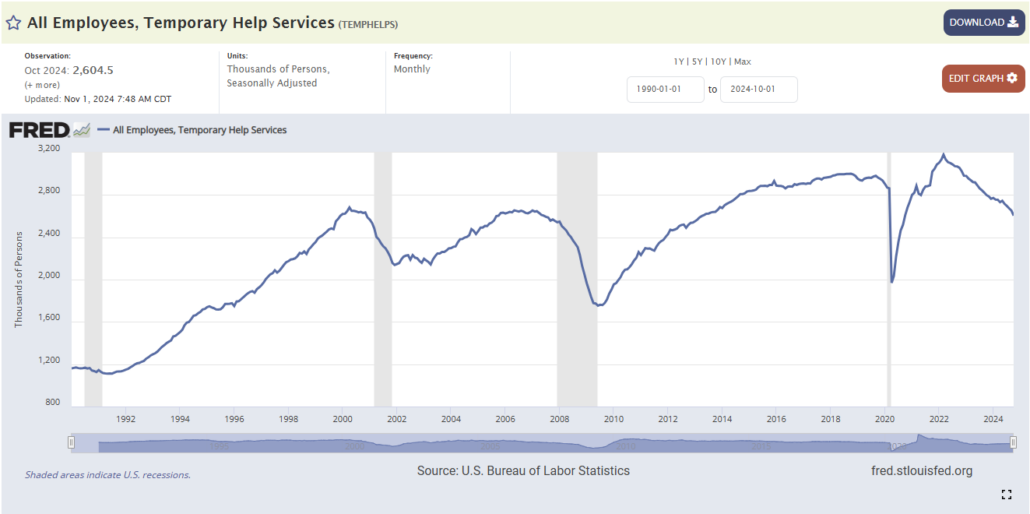
Heading into year-end, we obviously start to think about the set up to close the year, and more specifically, the setup to open the next year. One chart that is hard not to pay attention to is this one concerning power demand.

GS has a basket that tries to encapsulate this demand:

The chart is stunning:
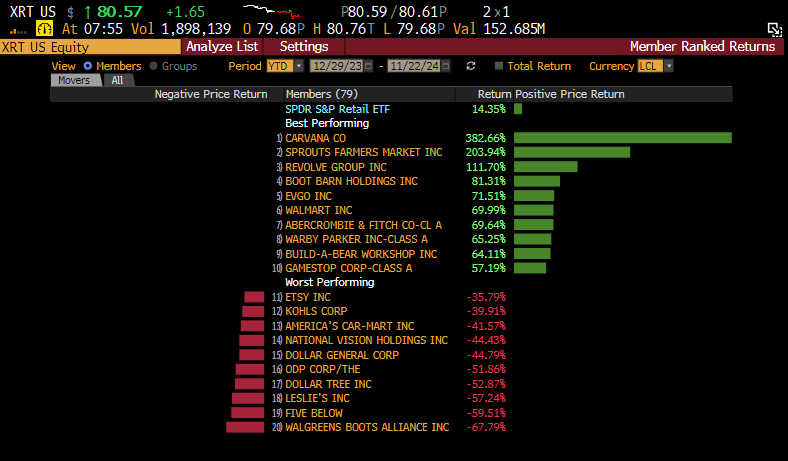
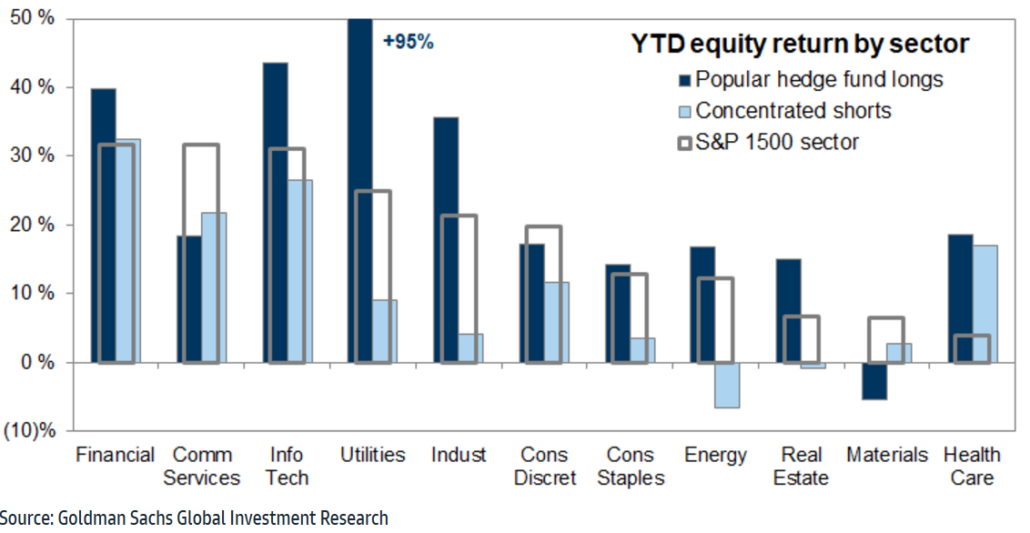
YTD Best and Worst performers:

Considering the MS chart above, is the GS basket’s recent “pullback” (yes we are being liberal with that definition here) worth taking another look at?
Only time will tell, but the MS thesis behind that demand out to 2028 is pretty “powerful.”

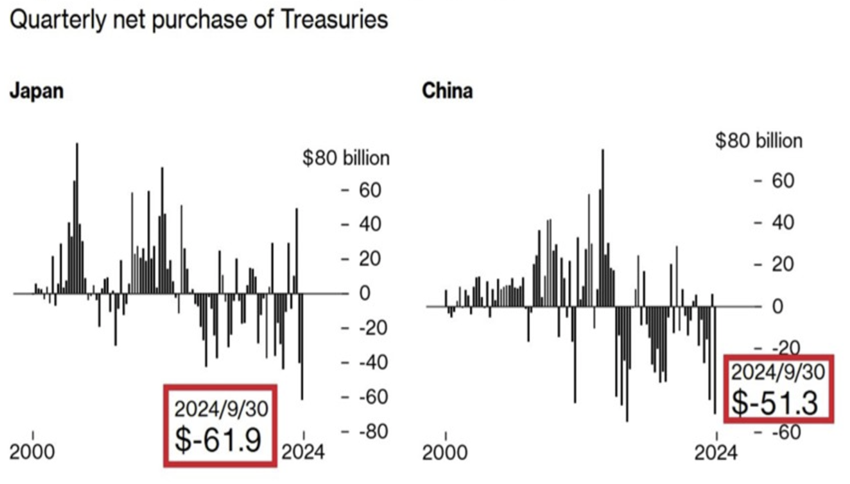
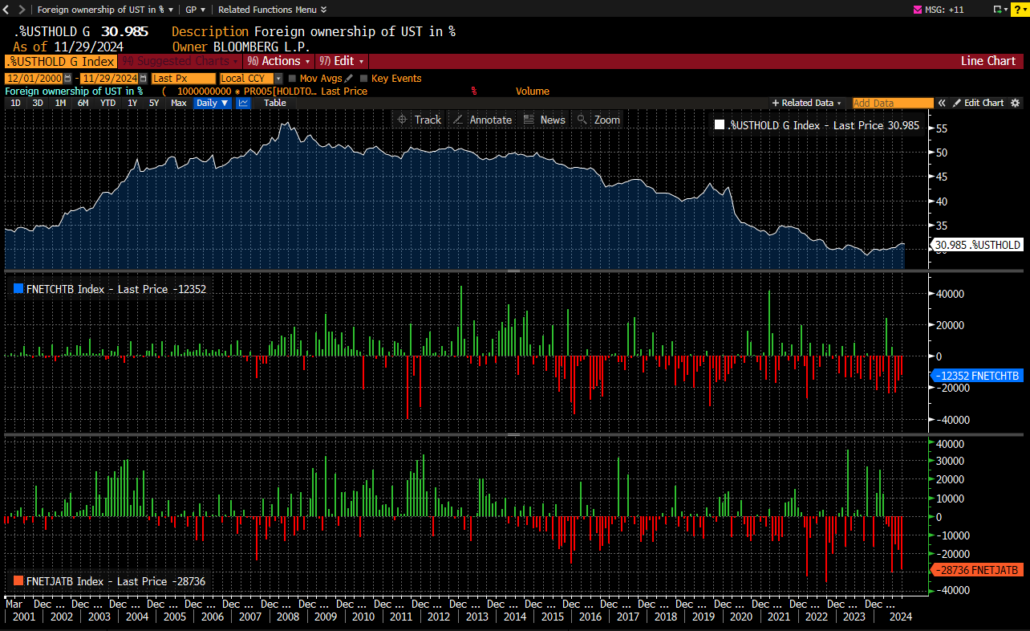
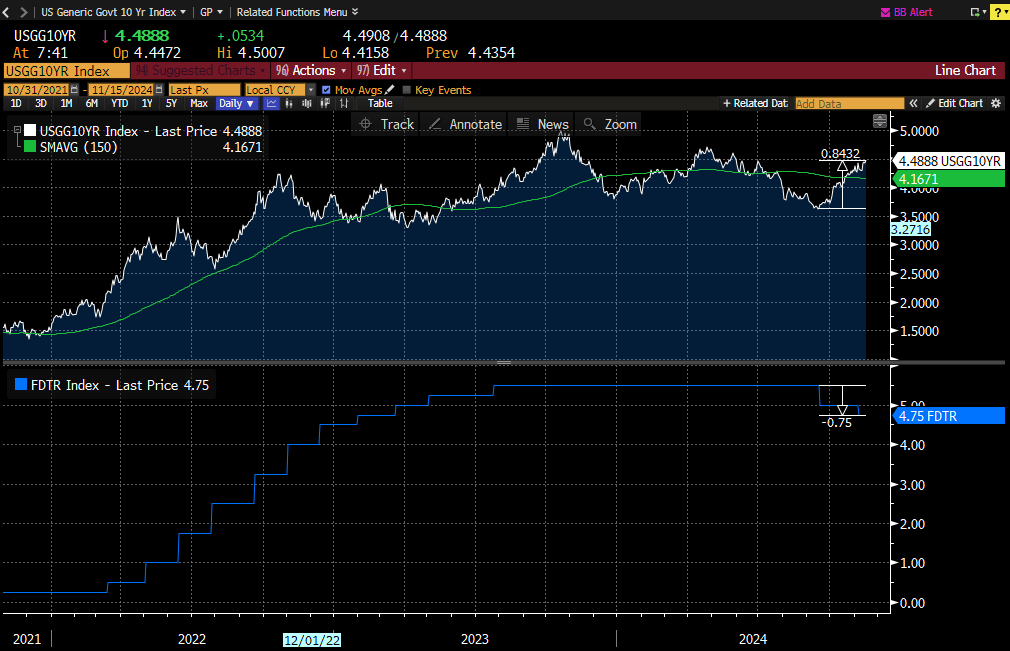
US Government Issuance vs Risk Assets
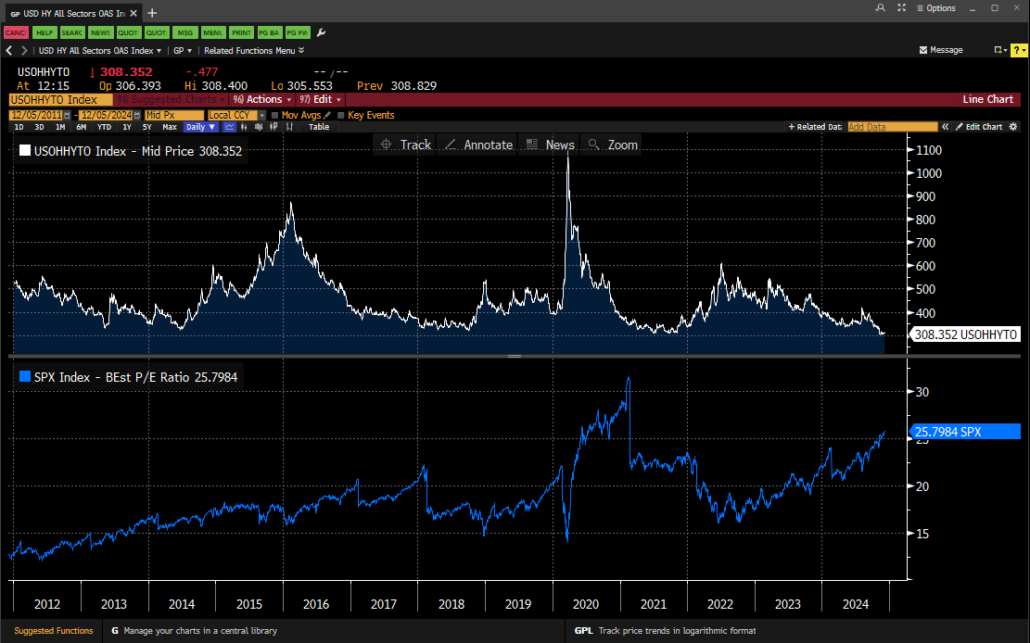
We did see an interesting article on Bloomberg this week that is highly technical in nature, but there is a standout metric in there that caught our eye.
The article focuses on Government issuance and its relationship to risk assets. The article states:
US Government Issuance vs Risk Assets
We did see an interesting article on Bloomberg this week that is highly technical in nature, but there is a standout metric in there that caught our eye.
The article focuses on Government issuance and its relationship to risk assets. The article states:
“Therefore we would expect to note a stronger relationship between government issuance and risk assets. We see just that. The ups and downs of the growth in shorter-term Treasury issuance has led the highs and lows of US equity-market growth by about 6-9 months, especially since the mid-2010s. The sharp drop off in the growth of issuance we have seen recently could become a problem for stocks next year.”
It continues:
“Whenever the percentage of the deficit funded by bonds has exceeded 100%, stocks have underperformed or sold off. The previous times this has happened are a checklist of rough years for the stock market spanning the past two decades: 2008, 2010, 2015, 2018 and 2022.”

With the deficit at its present level, and an incoming presidential administration, if that blue line trends higher, it would mean another couple red circles to add to the Bloomberg checklist.
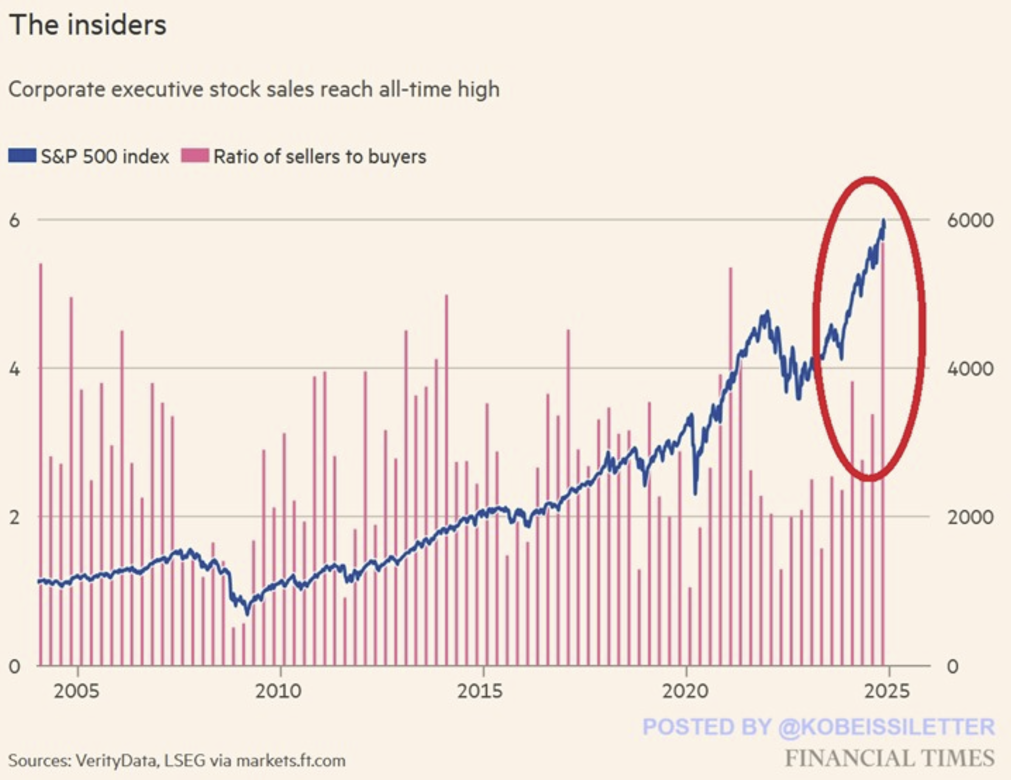
Equity Allocation levels
Many have seen these charts, but after a week where the VIX moved almost 100% in a day, we figure it’s worth pointing out that there may be a few too many investors thinking the same thing.

The charts:

Self-explanatory.
Have a great weekend!
Best,
Meraki Trading Team
About Meraki Global Advisors
Meraki Global Advisors is a leading outsourced trading firm that eliminates investment managers’ implicit and explicit deadweight loss resulting from inefficient trading desk architectures. With locations in Park City, UT and Hong Kong, Meraki’s best-in-class traders provide conflict-free 24×6 global trading in every asset class, region, and country to hedge funds and asset managers of all sizes. Meraki Global Advisors LLC is a FINRA member and SEC Registered and Meraki Global Advisors (HK) Ltd is licensed and regulated by the Securities & Futures Commission of Hong Kong.
For more information, visit the Meraki Global Advisors website and LinkedIn page
Contact:
Mary McAvey
VP of Business Development