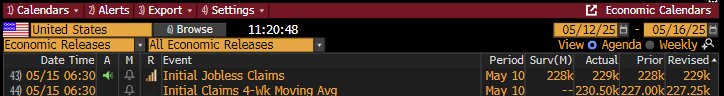
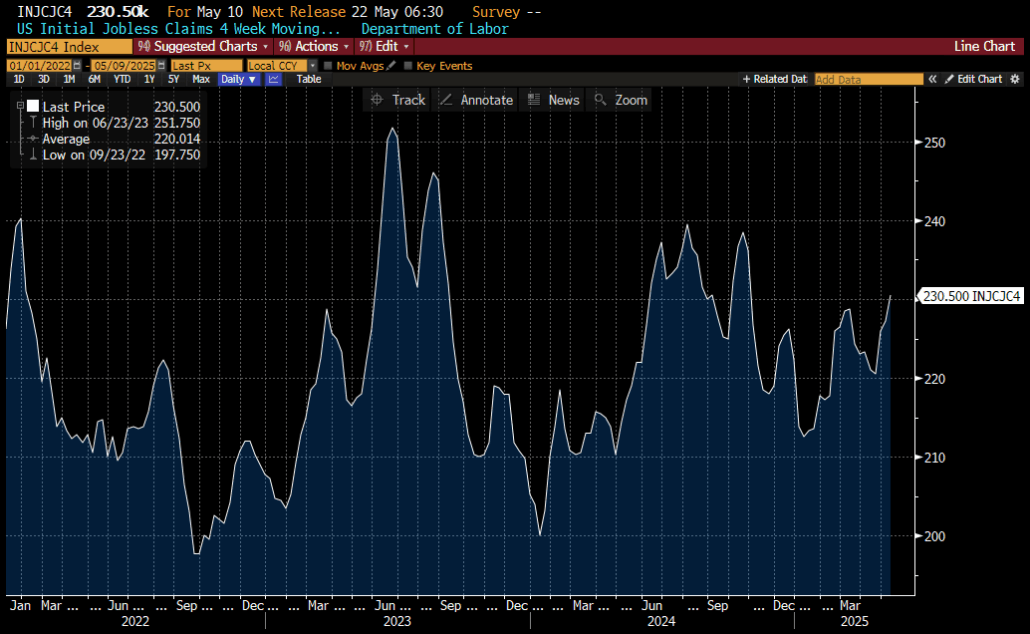
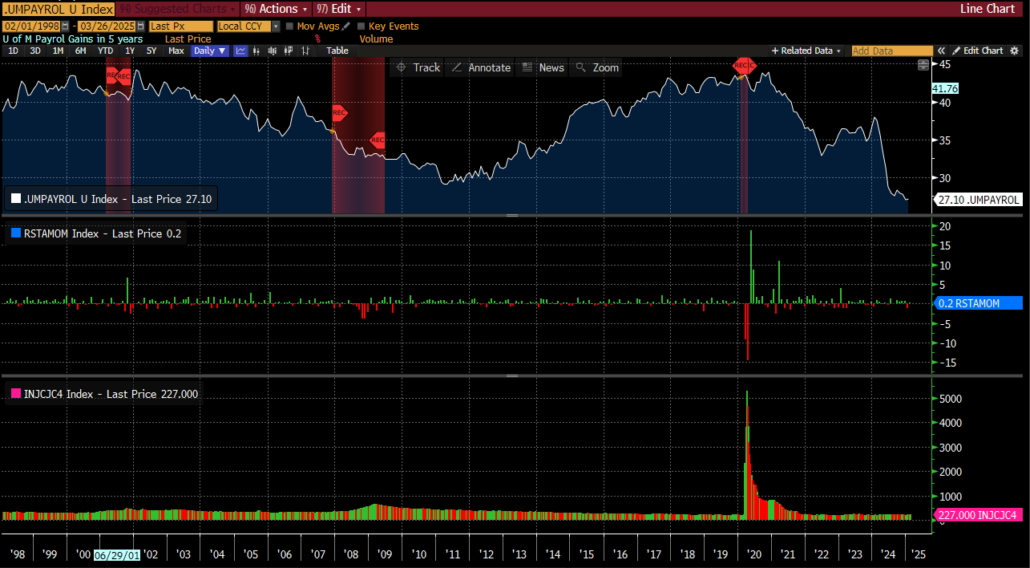
Using the 4-week moving average, which was 230.50k, it looks like claims have pretty much stayed in a range from 200 to 250k over the last 4 years.
The Federal reserve has indicated that without a weakening in the employment picture, the risks are evenly balanced presently not offering an opportunity for them to cut rates, despite the calls for it from the White House. Hard to argue with the numbers.
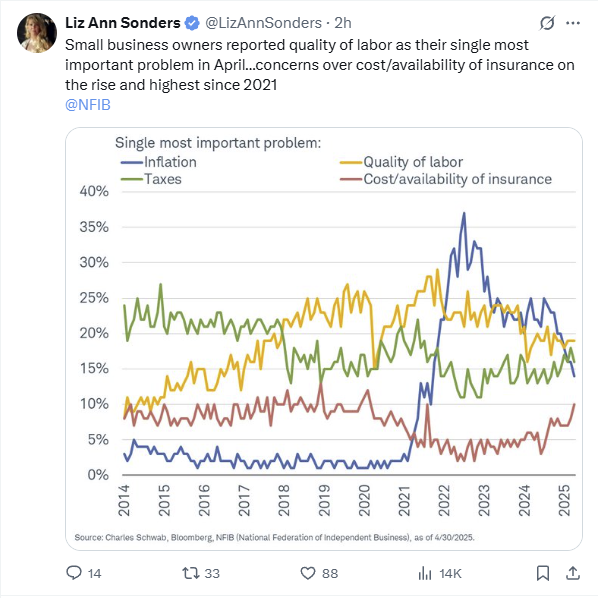
Then we came across this post below, which makes us think the employment demand picture may be stronger than some believe.
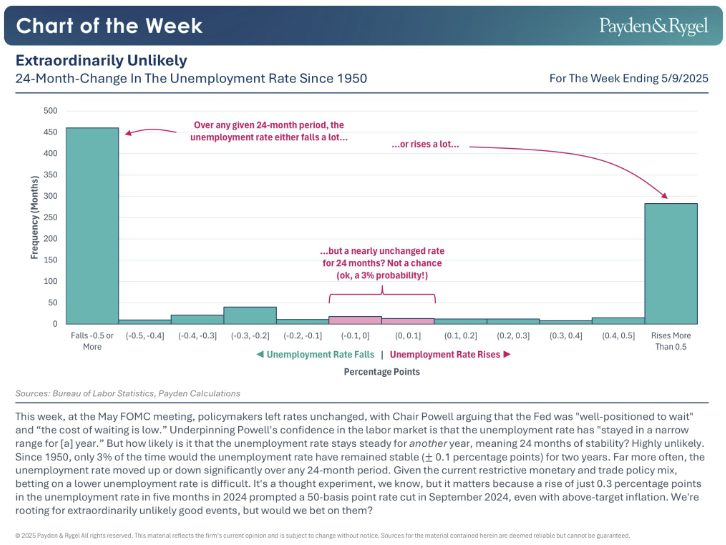
But complacency can be dangerous. According to the chart below the odds of unemployment not moving up soon are stacking up against us from an historical perspective.
The unemployment rate has been “in a narrow range” for the last year. But what are the odds of *another* 12 months of stable unemployment? It would be a very rare outcome, indeed.
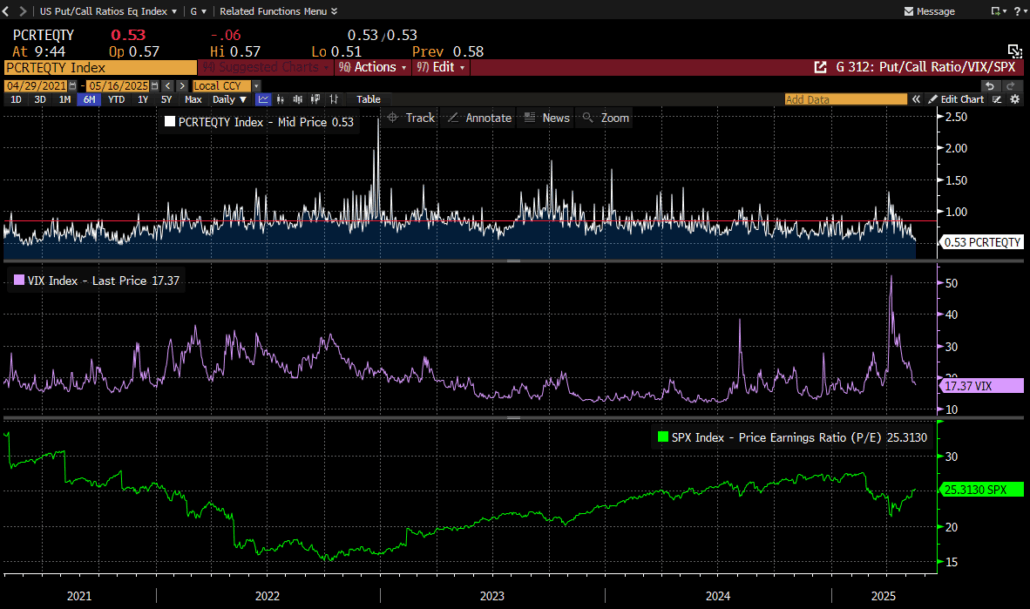
There was a bit of focus on the Put/Call ratio this week. The index hit its lowest level since November 8th, 2021, on a closing basis at .53. The VIX has responded accordingly, as well as the Price/Earnings multiple on the SPX.
From the below chart we are not sure that is indicative sign of anything.
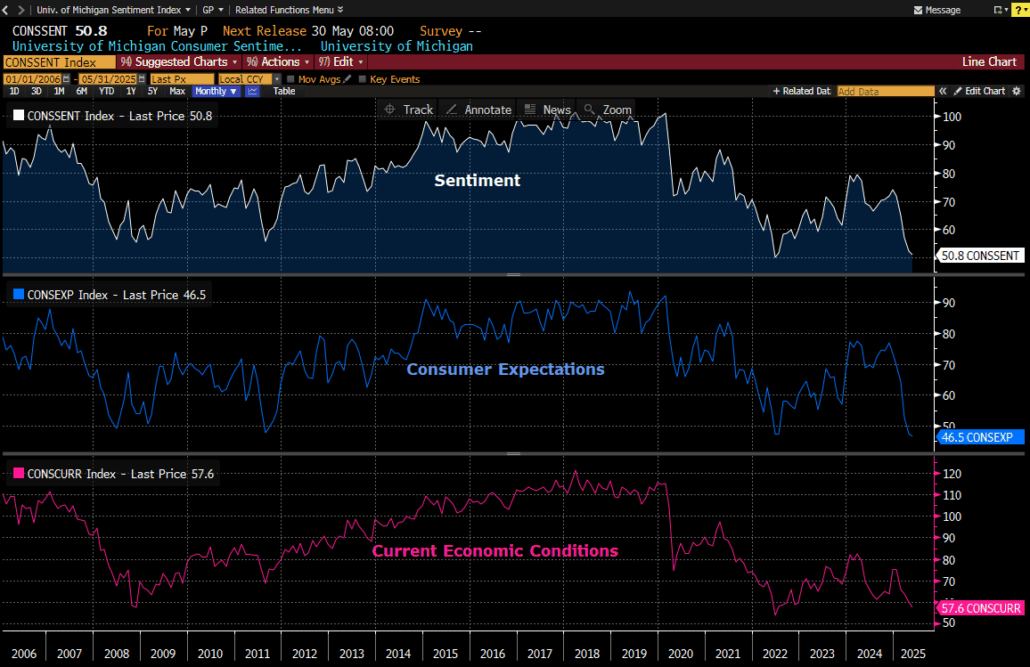
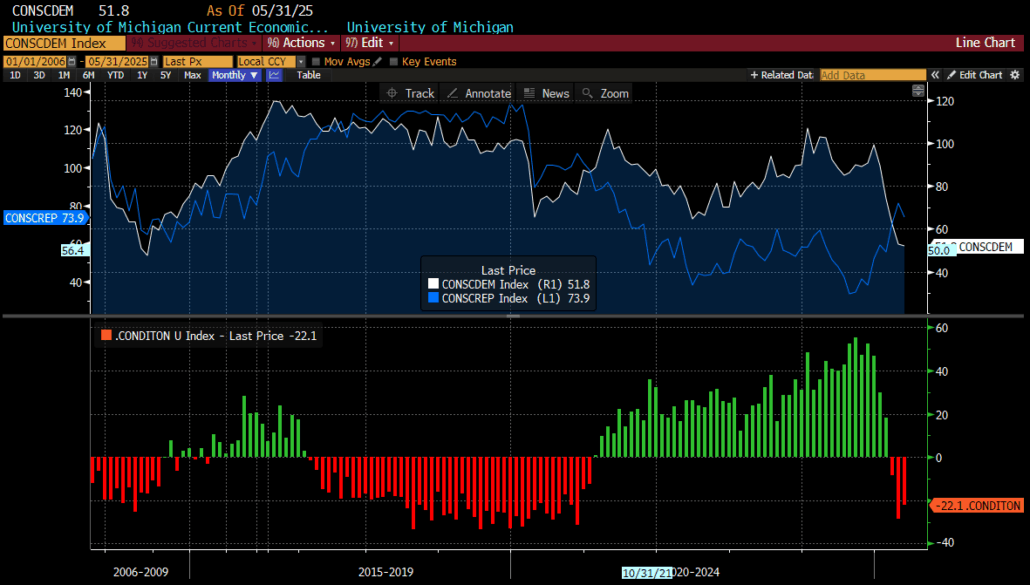
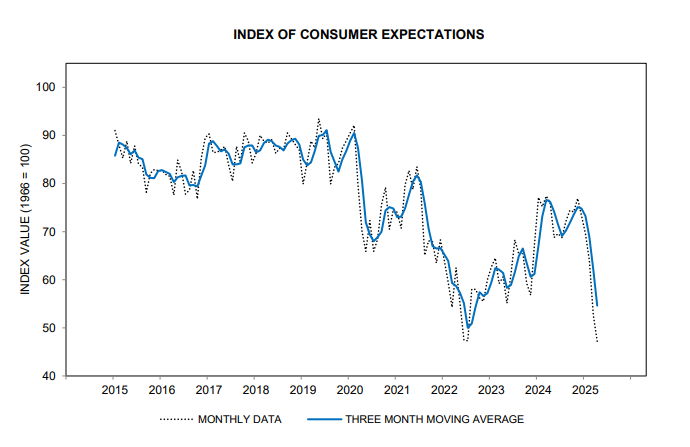
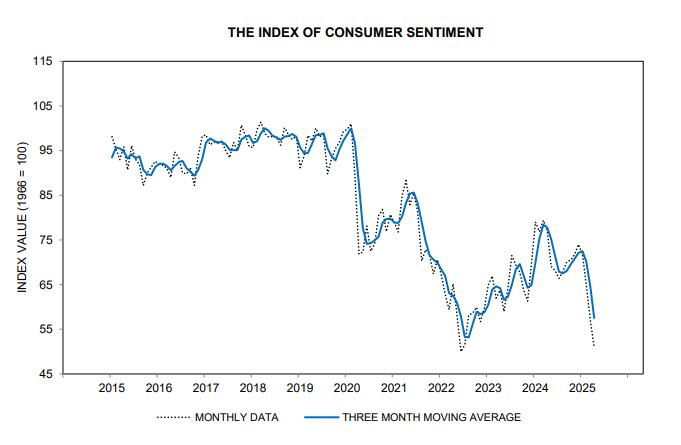
University of Michigan
The University of Michigan surveys were released today.
This may be considered one of the better examples of “soft” data that exists. The trend is not hard to spot of late.
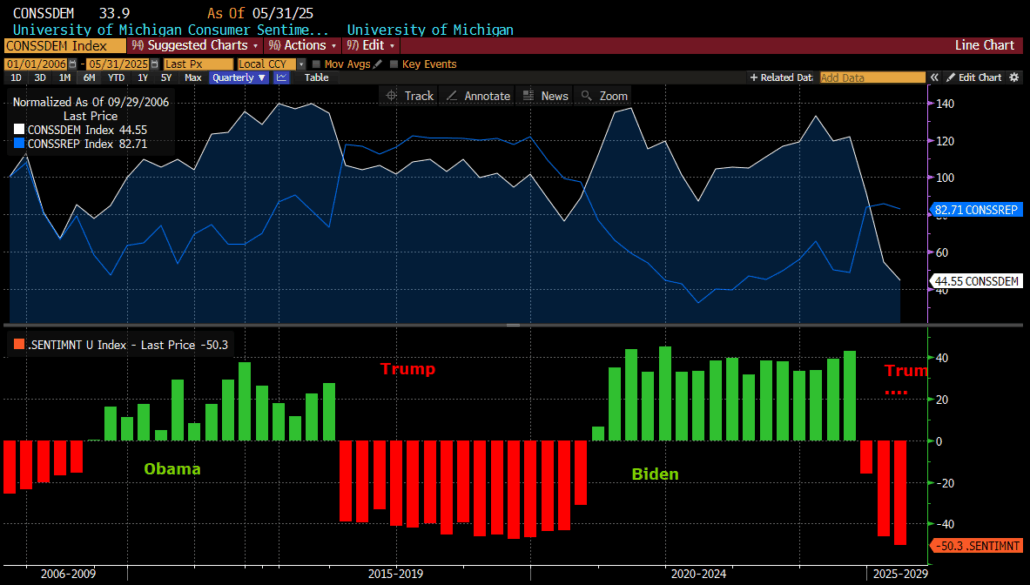
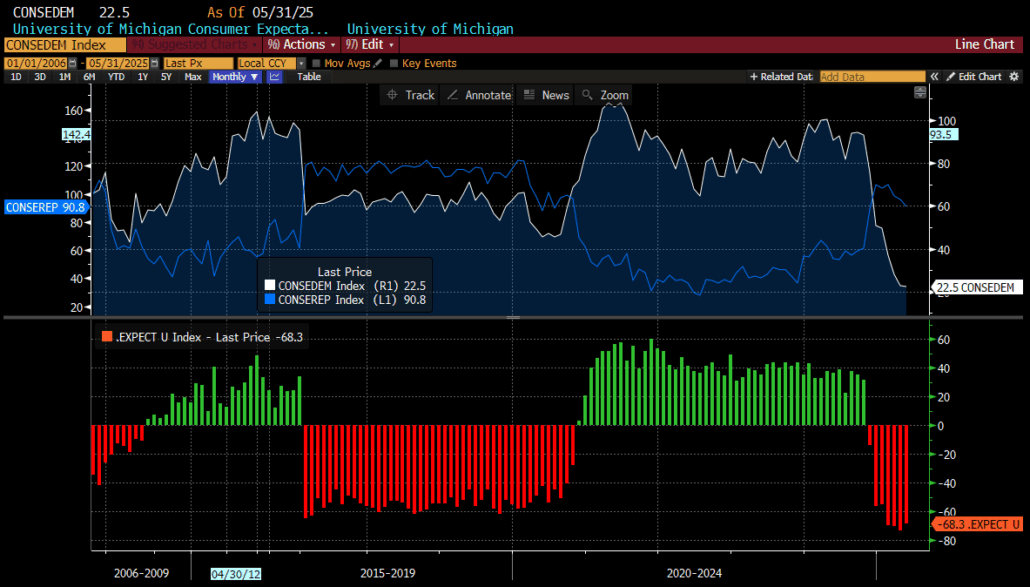
If we take a deeper dive with respect to these 3 indices it appears that political views play a major role. Below we chart the surveys from both a democrat and republican point of view. In the lower panel of each chart, we put the difference between those 2. It appears rather obvious that whichever party is occupying the White House feels better about things.
Sentiment
Consumer Expectations
Current Economic Conditions
What’s the takeaway? We are simply not sure that a greater negative bias is not over impacting the surveys during times when “your” party is out of the white house.
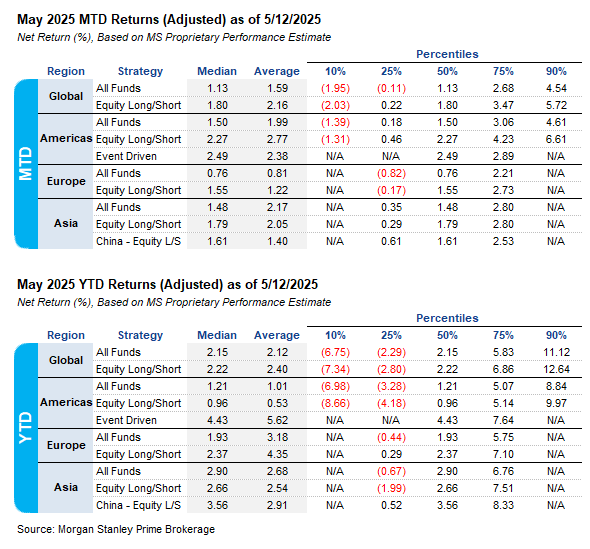
Performance Update
MS performance snapshot.
Have a great weekend!
Best,
Meraki Trading Team
About Meraki Global Advisors
Meraki Global Advisors is a leading outsourced trading firm that eliminates investment managers’ implicit and explicit deadweight loss resulting from inefficient trading desk architectures. With locations in Park City, UT and Hong Kong, Meraki’s best-in-class traders provide conflict-free 24×6 global trading in every asset class, region, and country to hedge funds and asset managers of all sizes. Meraki Global Advisors LLC is a FINRA member and SEC Registered and Meraki Global Advisors (HK) Ltd is licensed and regulated by the Securities & Futures Commission of Hong Kong.
For more information, visit the Meraki Global Advisors website and LinkedIn page Contact: Mary McAvey VP of Business Development
https://merakiglobaladvisors.com/wp-content/uploads/2025/05/Meraki-Weekly-Trading-Digest-2-scaled.png14402560Meraki Global Advisorshttps://merakiglobaladvisors.com/wp-content/uploads/2021/03/meraki-logo-1.pngMeraki Global Advisors2025-05-16 22:53:242025-05-16 22:53:25Employment/ Put Call ratio/ U of M #’s/Performance Update
Although it was an exciting week in current event terms, New Pope, Sabre rattling between India and Pakistan, and Air traffic control scares at Newark International Airport, the market itself was rather uneventful with respect to performance
We can’t say we saw too many themes worth mentioning this week, but there were a few.
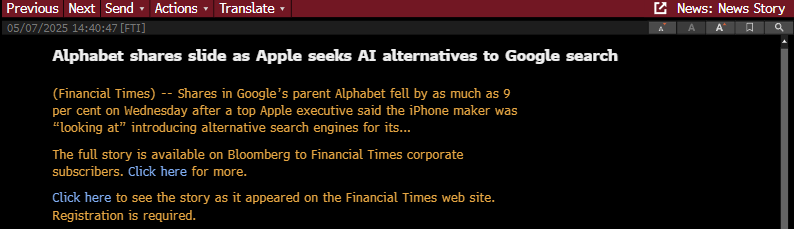
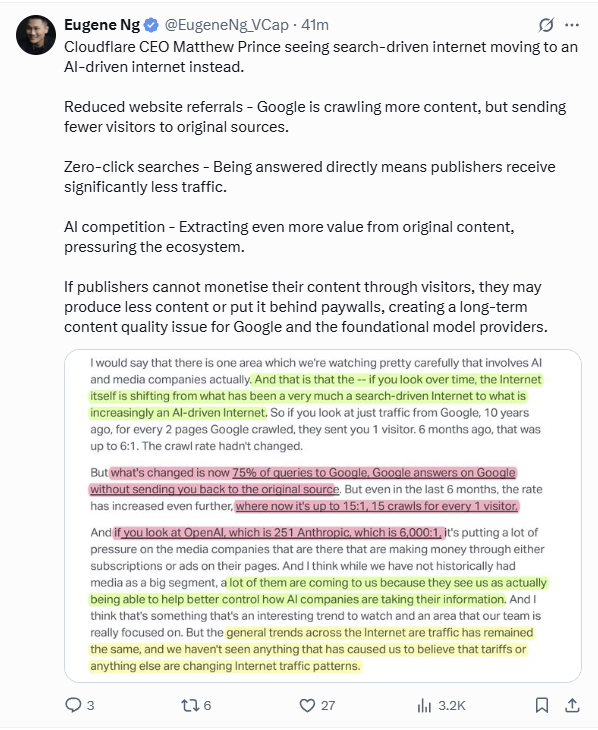
Internet landscape shift?
On Wednesday, May 7th an Apple executive caught the market off guard.
We mention this, not because of the impact on GOOGL and AAPL, but from a broader thought process concerning the paradigm for internet usage.
How people use the internet for search may well be shifting, and we thought this post might explain it much better than we ever could.
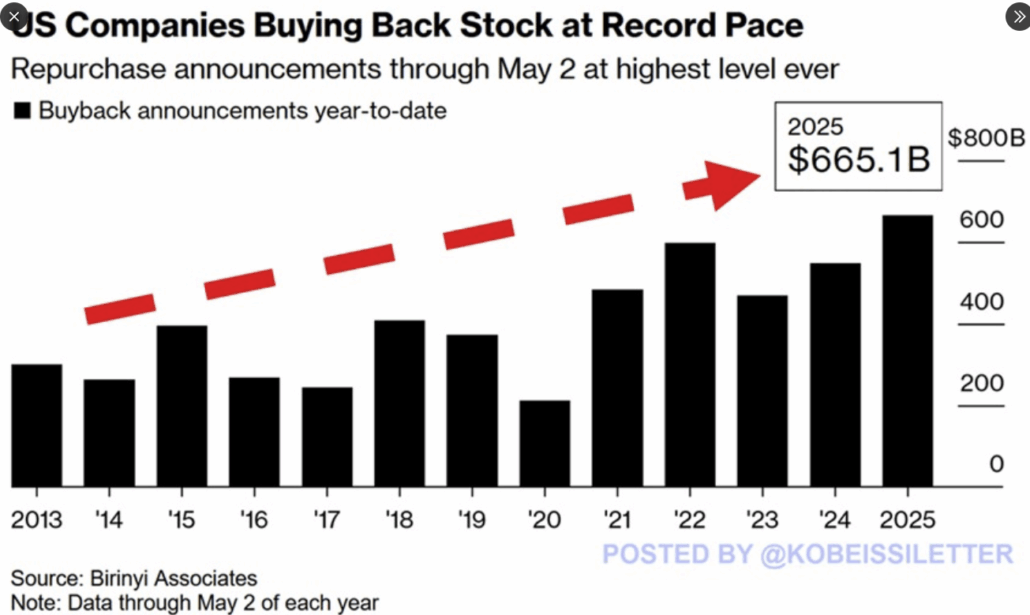
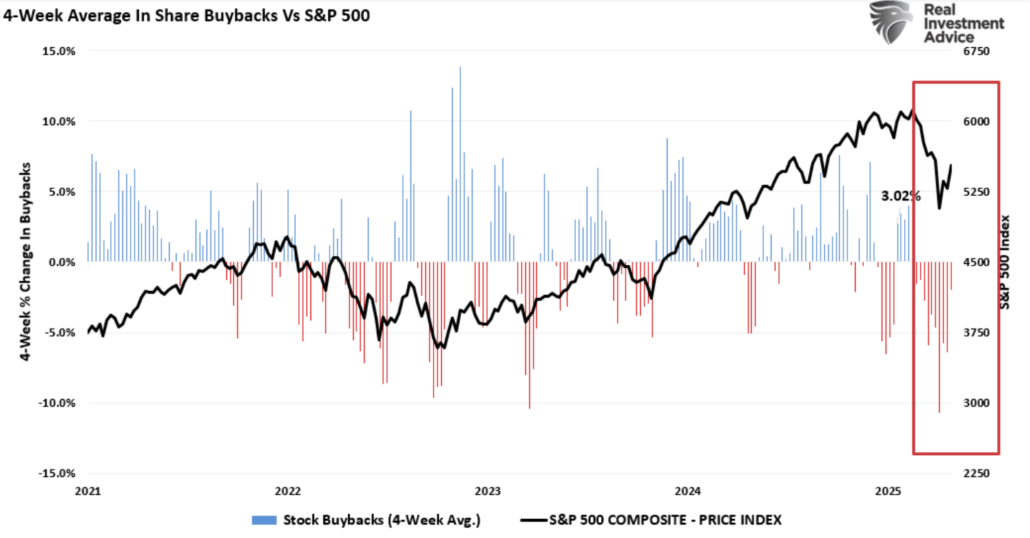
Back to market impactful news. Buybacks are not slowing at all.
US companies announced $233.8 billion in buybacks in April, the second-highest amount since data began in 1984.
This is a sharp reversal from the $39.1 billion announced in March, the least since October 2020.
Year-to-date, repurchase announcements have reached a record $665.1 billion.
Buyback announcements have now surpassed the previous high of $598.5 billion set in 2022.
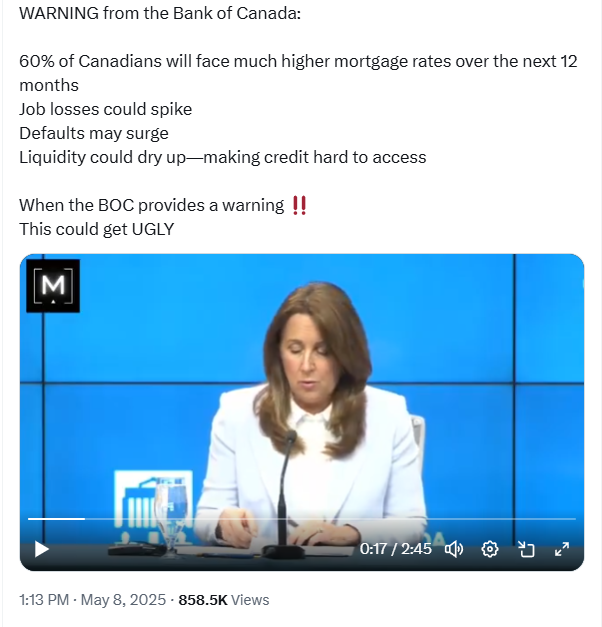
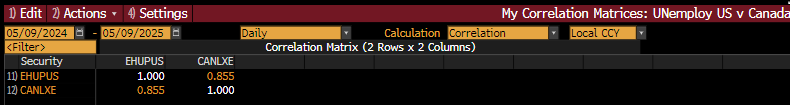
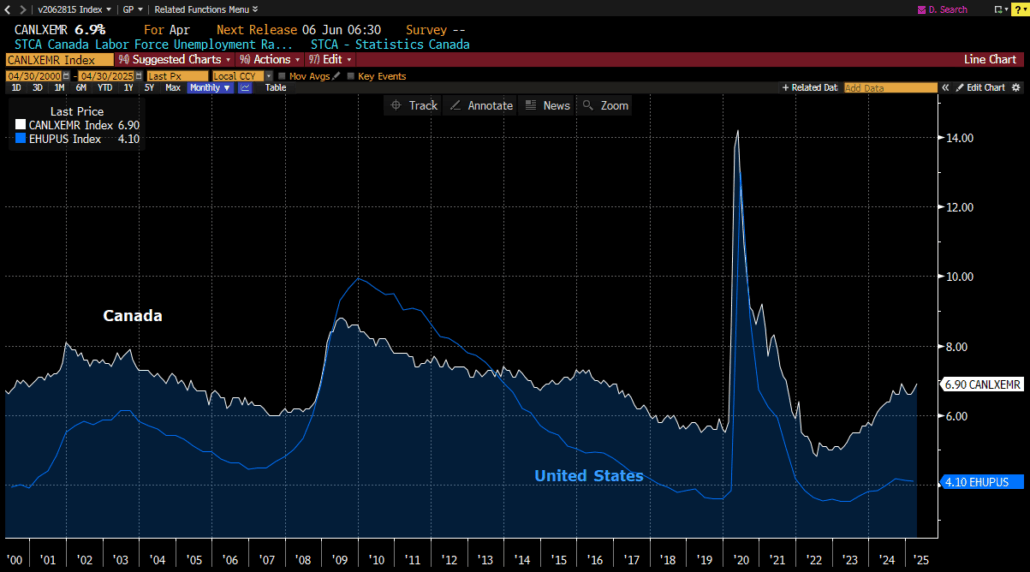
Canadian Unemployment
We know, why mention something as obscure as this? Well we were thinking this might be a canary in the coal mine with respect to tariff impacts. At least, that is what Canadian Government officials appear to be pointing to.
We looked at the recent correlation between the US and Canada with respect to Unemployment levels.
As the clip above provides, the most recent Unemployment levels were just released.
Canada’s unemployment rate surged to +6.9%, above expectations, marking its highest level since 2021. Canada’s youth unemployment rate now stands at a whopping 13.7%.
Are tariffs already taking their toll in Canada?
Some of the above rhetoric seems a bit alarmist to us, but the math suggests it is something to keep an eye on.
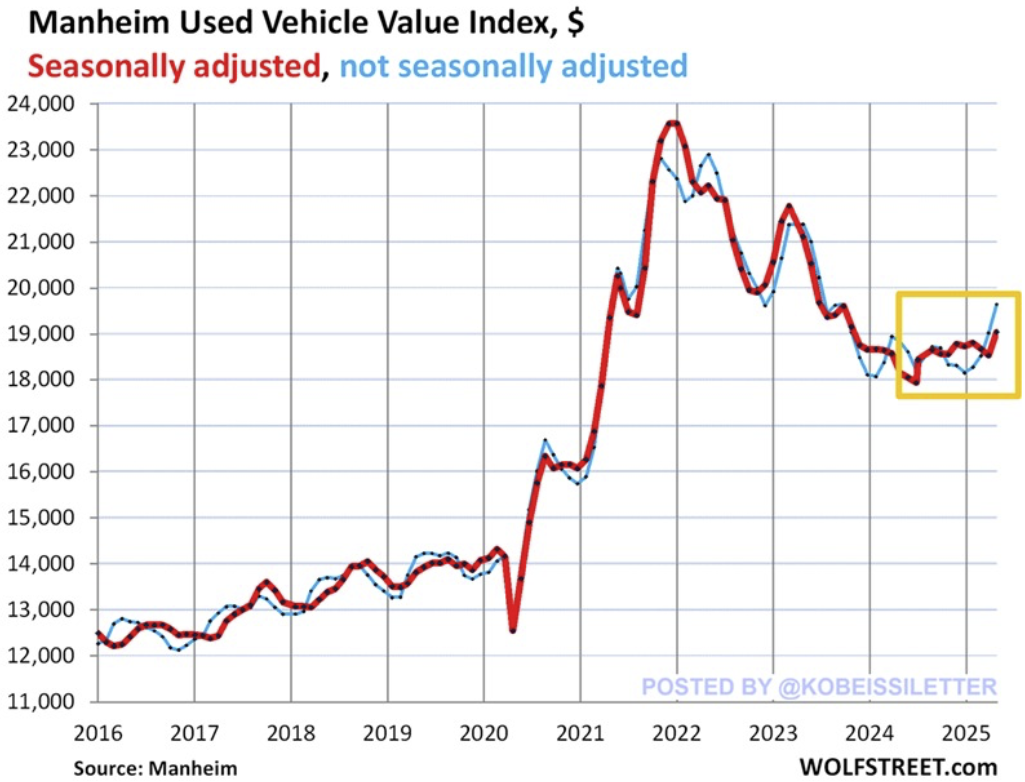
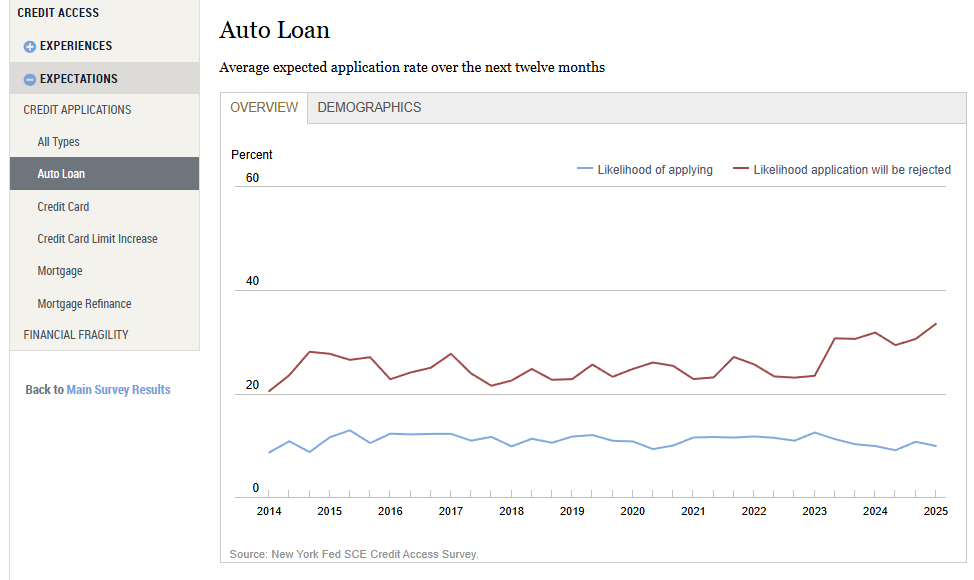
Autos
Is car ownership becoming a luxury?
US used car prices are surging. Wholesale used vehicle prices jumped +4.9% year-over-year in April, to their highest since October 2023. Month-over-month, car prices rose +2.7%, marking the 2nd consecutive monthly increase. The biggest year-over-year increase was recorded in the luxury and SUV segments, at +5.9% and +5.5%. Non-EVs, pickups, and EVs prices rose by +4.7%, +2.5%, and +1.6%, respectively. Car prices are now 38% higher than they were before the 2020 pandemic.
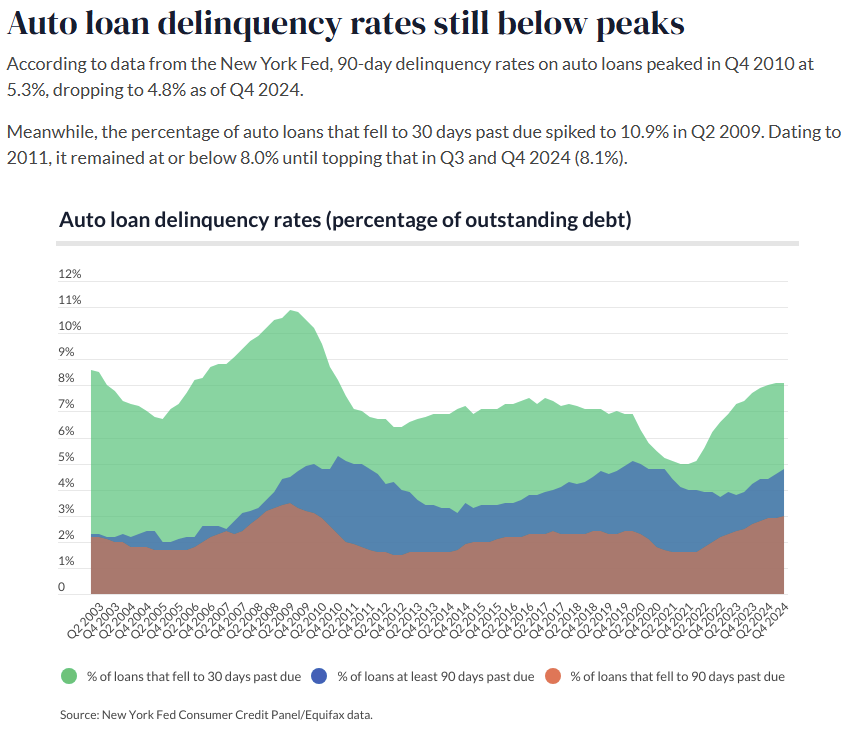
The issue with the higher prices.
Auto loan delinquency rates are up compared to a year ago. 4.8% of outstanding auto debt was at least 90 days late in Q4 2024, according to the New York Fed, up 15.8% from Q4 2023. Meanwhile, the percentage of auto loans that fell to 30 days past due was 8.1% in Q4 2024, up 5.1% from 7.7% in Q4 2023.
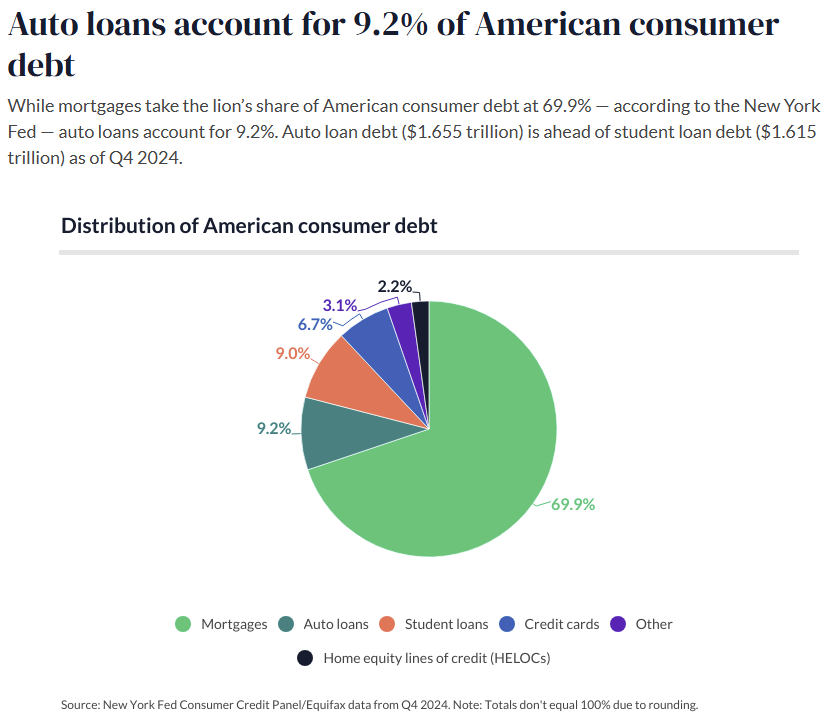
Fortunately, Auto loans only represent 9.2% of total consumer debt.
Notice the 9% orange color above though. Close to the second place Auto category, and as of this month the moratorium on paying student debt back is lifted. Will that be a straw on the camel’s back?
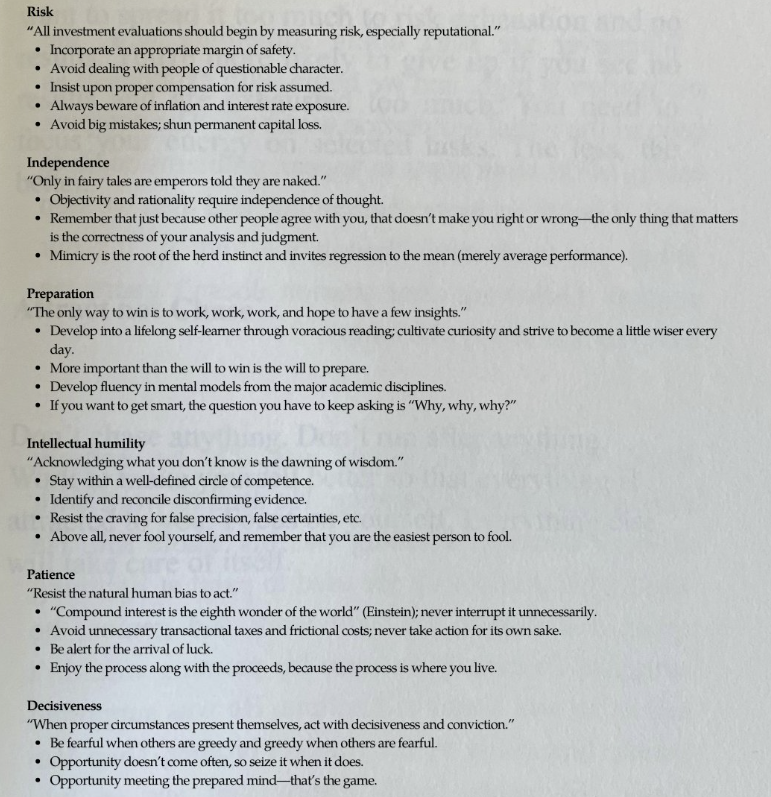
Munger’s Checklist
In honor of the annual Berkshire Investors meeting this past week, we thought it worth breaking the following out.
Charlie Munger’s checklist for clear thinking.
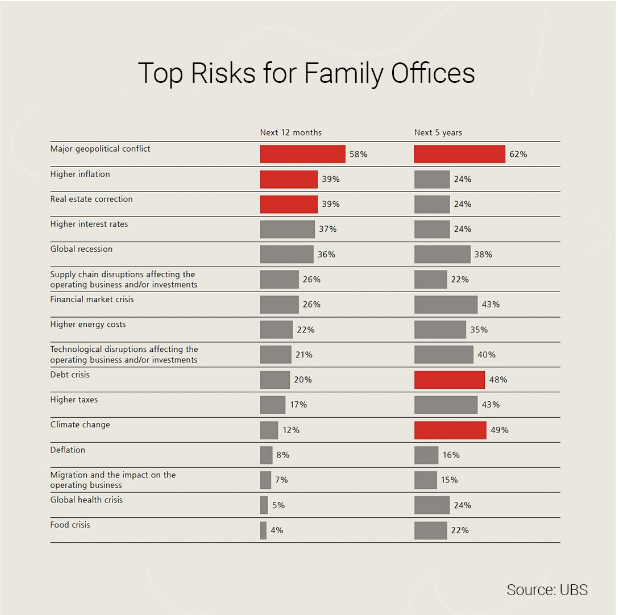
Top Risks
According to the UBS Global Family Office Report 2024, 62% of family offices cite a major geopolitical conflict as their top long-term concern. Even 58% rank it as the single greatest threat to their portfolios.
Have a great weekend!
Best,
Meraki Trading Team
About Meraki Global Advisors
Meraki Global Advisors is a leading outsourced trading firm that eliminates investment managers’ implicit and explicit deadweight loss resulting from inefficient trading desk architectures. With locations in Park City, UT and Hong Kong, Meraki’s best-in-class traders provide conflict-free 24×6 global trading in every asset class, region, and country to hedge funds and asset managers of all sizes. Meraki Global Advisors LLC is a FINRA member and SEC Registered and Meraki Global Advisors (HK) Ltd is licensed and regulated by the Securities & Futures Commission of Hong Kong.
For more information, visit the Meraki Global Advisors website and LinkedIn page Contact: Mary McAvey VP of Business Development
https://merakiglobaladvisors.com/wp-content/uploads/2025/05/Meraki-Weekly-Trading-Digest-1-scaled.png14402560Meraki Global Advisorshttps://merakiglobaladvisors.com/wp-content/uploads/2021/03/meraki-logo-1.pngMeraki Global Advisors2025-05-09 23:40:302025-05-09 23:43:47Landscape Shift/ Buybacks/ Canadian Unemployment/ Autos/ Munger’s Checklist/ Top Risks
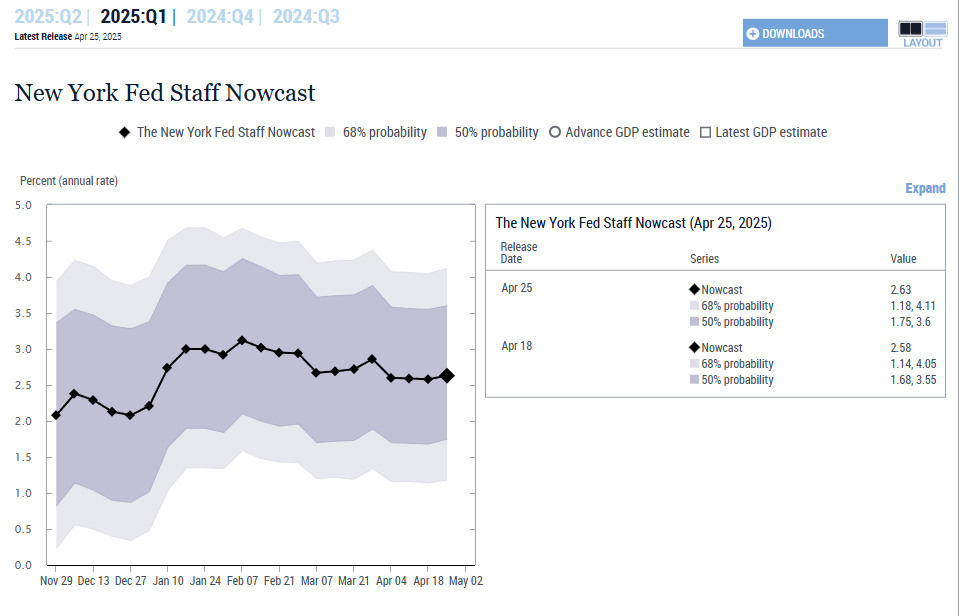
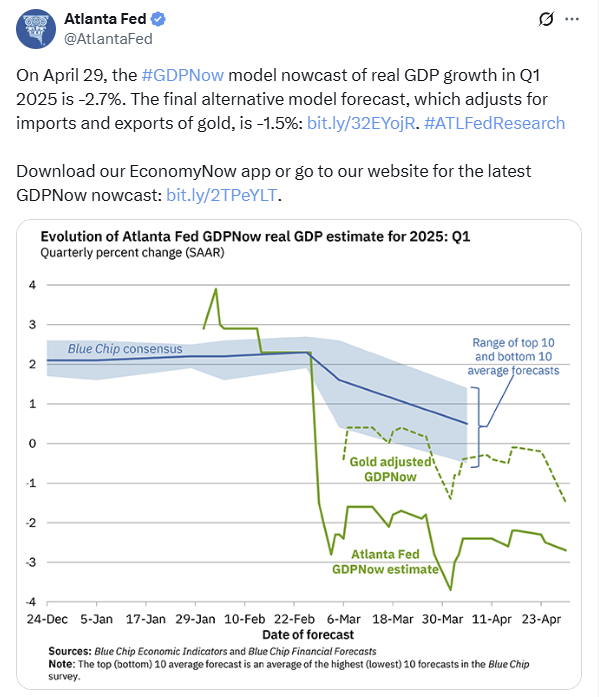
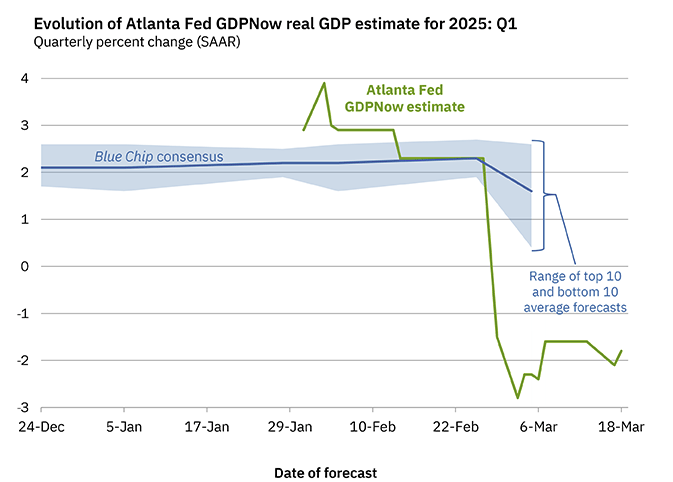
Which Fed branch, Atlanta, or NY, was closer on the Q1 GDP call?
Short answer neither.
We know, shocker.
Final estimates:
NY was at 2.63%
Atlanta at -2.7%
So, 2.63 and -2.7% average = -0.035 Actual: -0.03
Wisdom of the crowd, ala Malcolm Gladwell?
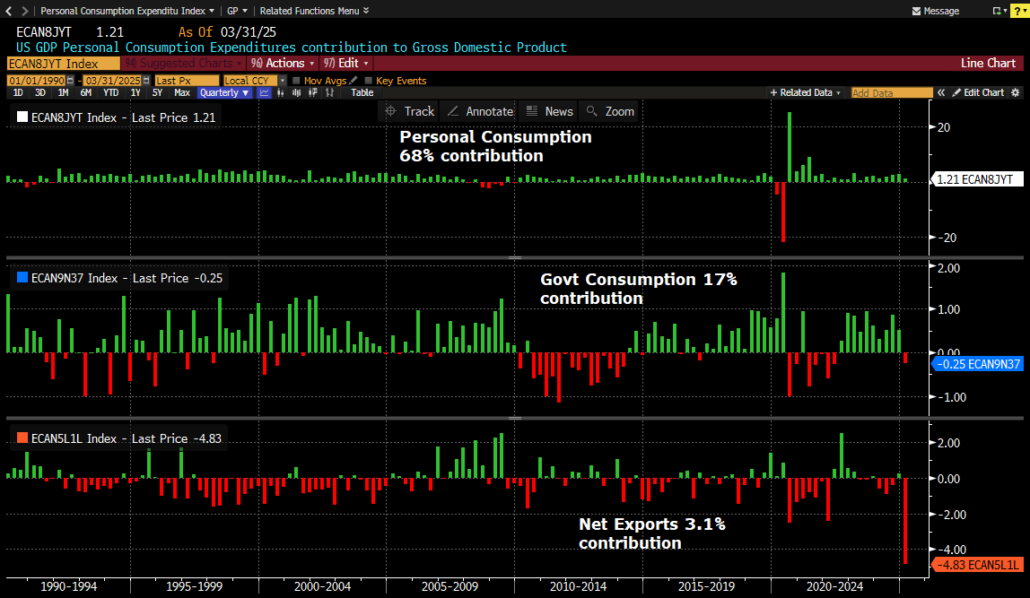
With respect to the latest print though we wonder if the Net Export contribution will continue to impact the way it did this print?
Net Export contribution is 3.1% of the total number.
What happens when Personal Consumption and Govt spending slow more, presently at an 85% contribution?
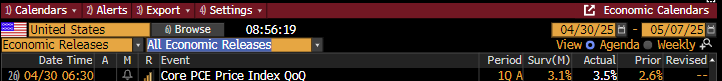
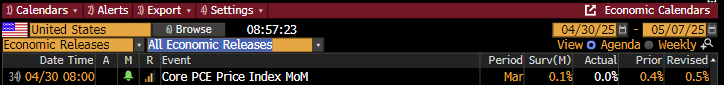
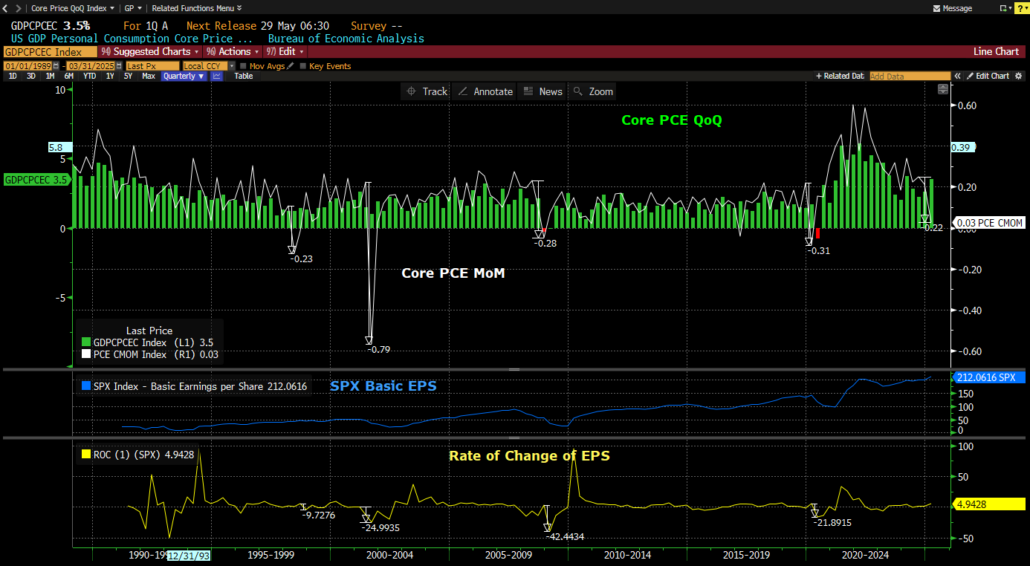
CORE PCE
Wednesday, April 30th, a favorite Federal Reserve metric was released, Core PCE.
The difference between QoQ and MoM caught our eye.
QoQ
MoM
The Q1 Core PCE price moved up more than expected to 3.5%, above the 3.1% estimate, but the Core PCE price for MoM was flat, down from an adjusted +0.5% the previous month.
The delta on this metric is slowing. We know we are a bit in the weeds here, but we were curious to see what has happened historically when there is drawdown of similar magnitudes on the MoM metric.
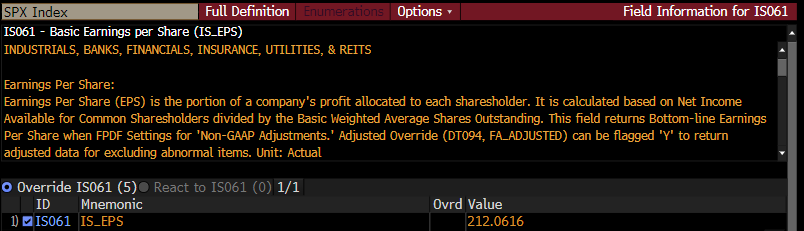
The chart below provides both metrics above back to 1989, histogram showing QoQ, while the white line is MoM in the top panel.
The middle panel includes the SPX historic EPS. Note, it will not look close to what current earnings estimates are for the SPX index, so providing the exact Bloomberg definition for clarity.
The bottom panel shows the rate of change of the EPS above it.
What’s the point? Well, the point is to suggest that we have yet to experience the impact that is normally felt during times when that Core PCE MoM moves like it has in the past.
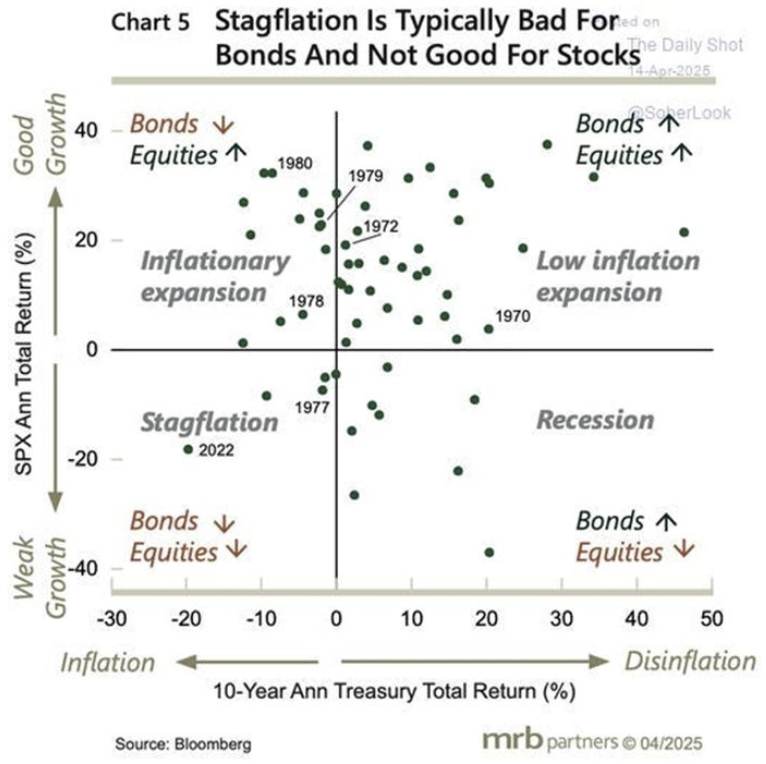
Stagflation
There is a prevailing view that tariffs are likely to put upward pressure on prices and downward pressure on the economy.
Apollo takes the thesis a step farther with their scenario analysis:
AI alone could drive electricity demand equivalent to adding another US economy in the next 5 years. If onshoring really picks up, the US could be headed for a similar surge in power demand. Three words come to mind:
Couple random charts that caught are eyes this week.
April was tough month for buybacks, but help is on the way with the window about to reopen:
Is the consumer under more duress than we think?
Who’s going to be left to pay for social security?
Have a great weekend!
Best,
Meraki Trading Team
About Meraki Global Advisors
Meraki Global Advisors is a leading outsourced trading firm that eliminates investment managers’ implicit and explicit deadweight loss resulting from inefficient trading desk architectures. With locations in Park City, UT and Hong Kong, Meraki’s best-in-class traders provide conflict-free 24×6 global trading in every asset class, region, and country to hedge funds and asset managers of all sizes. Meraki Global Advisors LLC is a FINRA member and SEC Registered and Meraki Global Advisors (HK) Ltd is licensed and regulated by the Securities & Futures Commission of Hong Kong.
For more information, visit the Meraki Global Advisors website and LinkedIn page Contact: Mary McAvey VP of Business Development
https://merakiglobaladvisors.com/wp-content/uploads/2025/05/Meraki-Weekly-Trading-Digest.png16202880Meraki Global Advisorshttps://merakiglobaladvisors.com/wp-content/uploads/2021/03/meraki-logo-1.pngMeraki Global Advisors2025-05-03 23:23:502025-05-03 23:36:26GDP/ Stagflation/ Electricity/ Random Charts
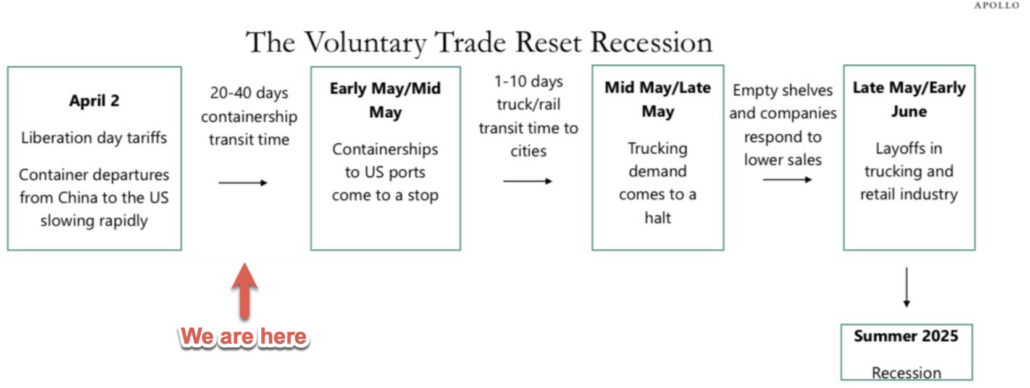
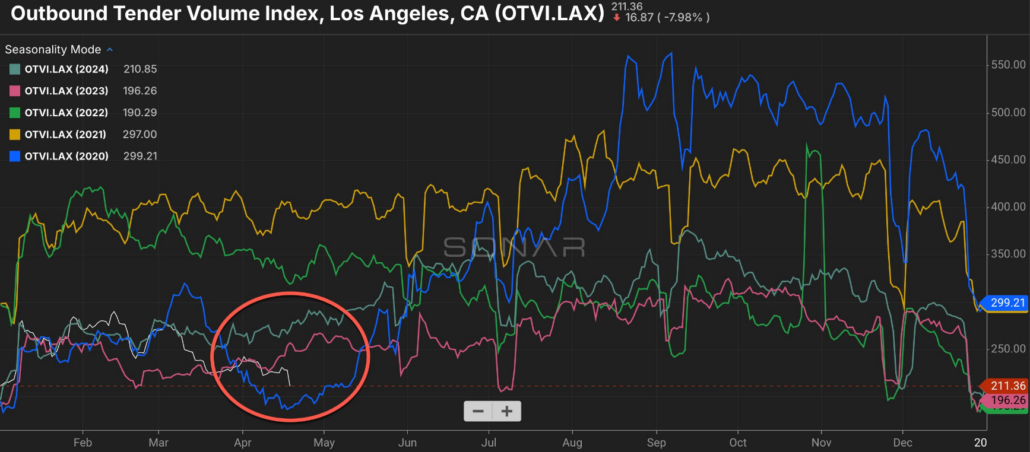
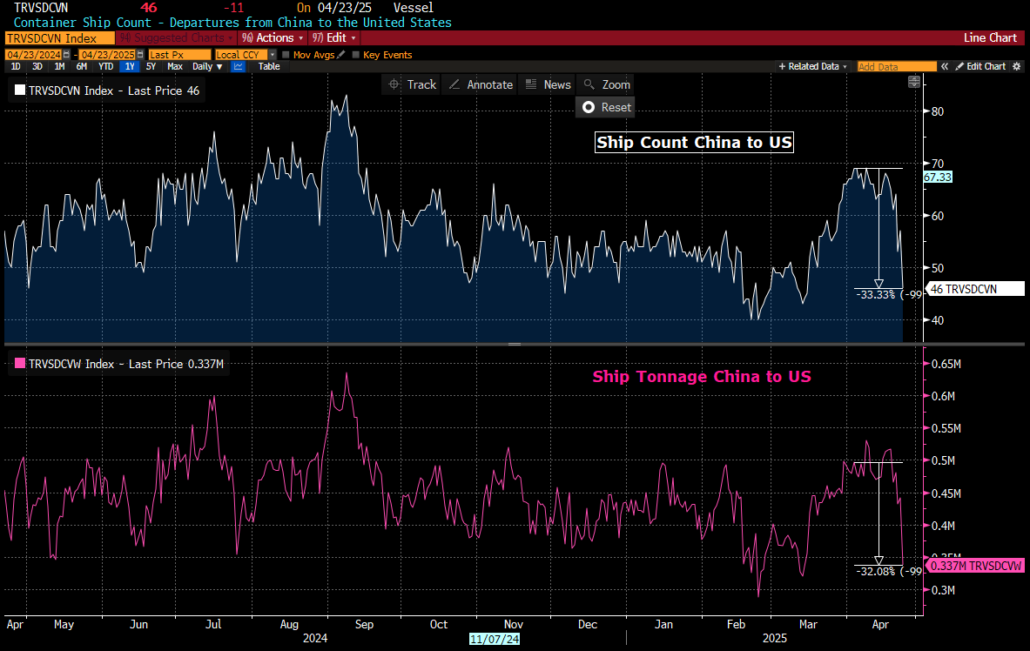
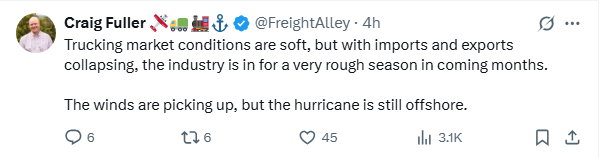
With all this tariff talk there has started to be quite a focus on shipments to the US, or lack thereof. Hard not see a chart of container, truck, or port utilization of late.
We would like to try and put some of the pieces together the way we see them.
So far 2025 is off to a bleak start, bested only by 2020 recently. Below is domestic freight out of the LA port. Less stuff leaving the port after being dropped off.
The below chart might help explain why.
Departures from China to the US in both ship count, white line, and tonnage, magenta line.
Both down roughly 32%!
Now, it takes 30 days for containers to go from China to LA.
So, the impact of the 32% drop off has yet to be fully felt.
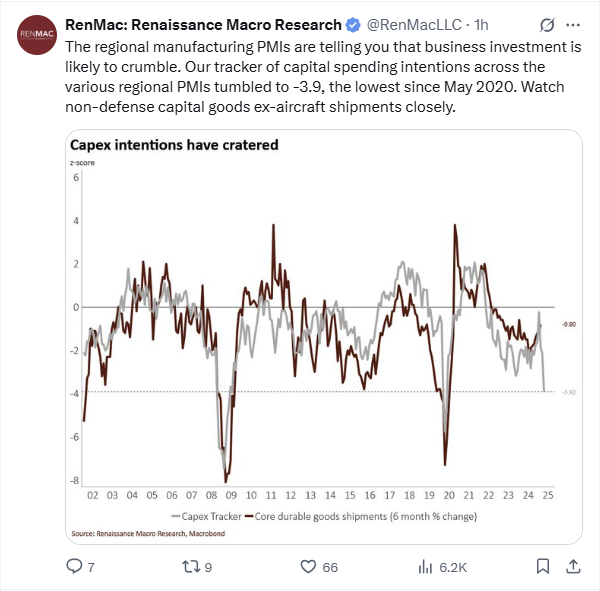
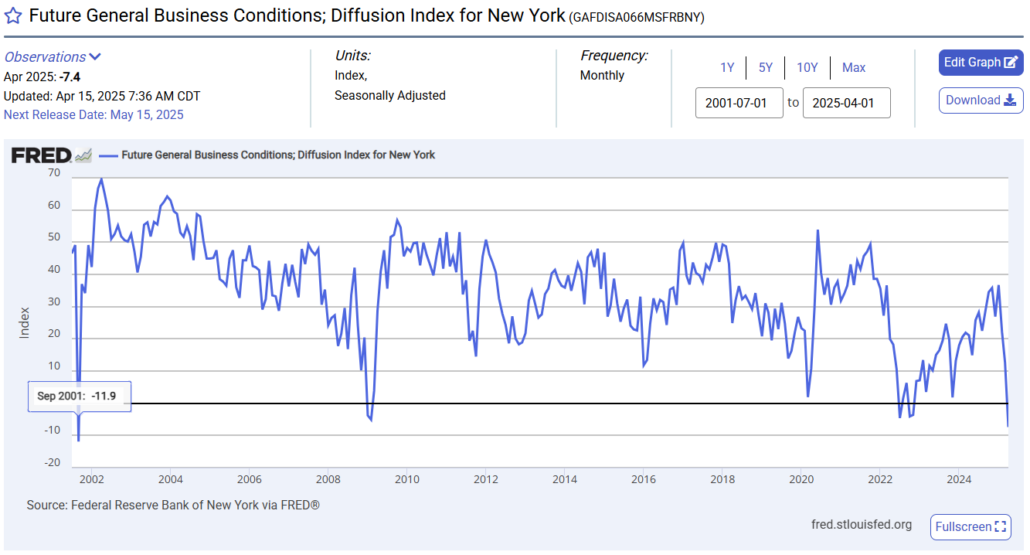
And that led us to wonder about business confidence and whether the lack of it will lead to less CapEx as well.
Which takes us to this chart:
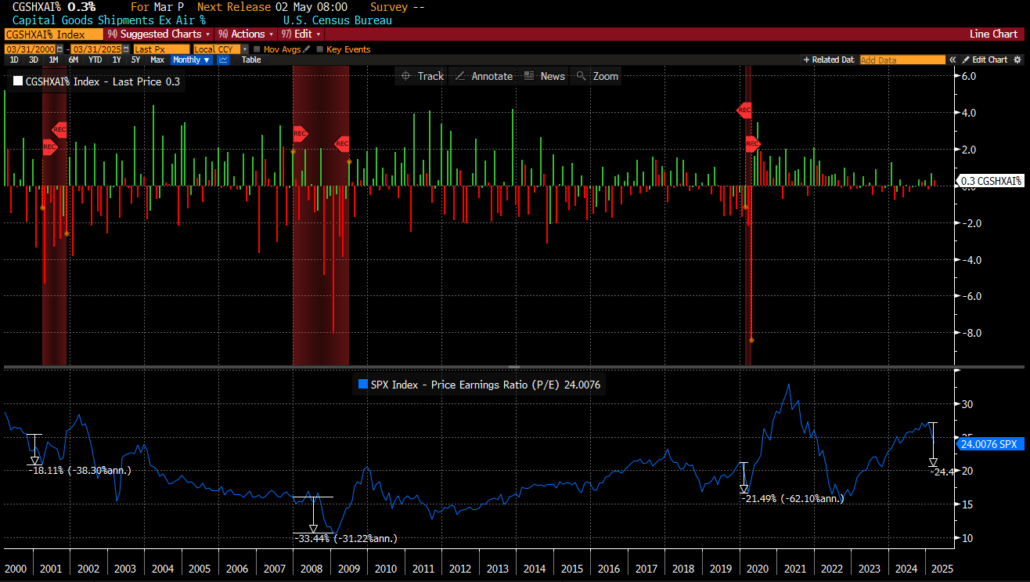
We took the above to heart and wanted to see how the Cap Goods shipments Nondef Ex Air looked presently. Maybe it’s coincidental or maybe causational, but when that metric moves substantially lower, GDP definitely slows down, and with-it trailing P/E multiples.
It has not rolled over just yet, but when it does it could definitely be an issue.
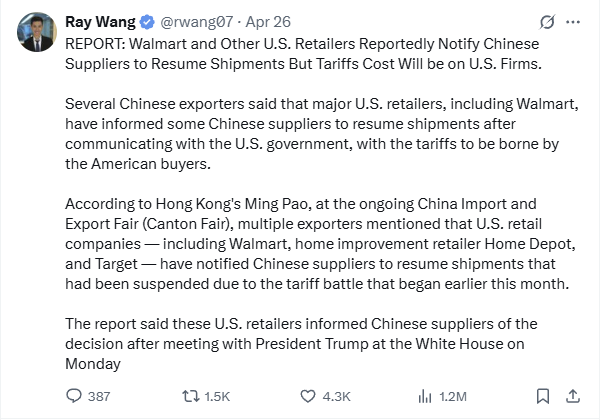
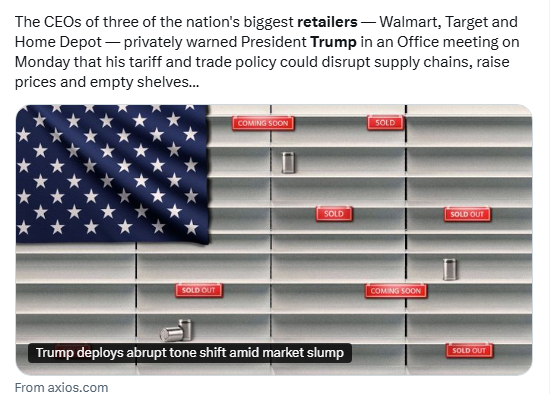
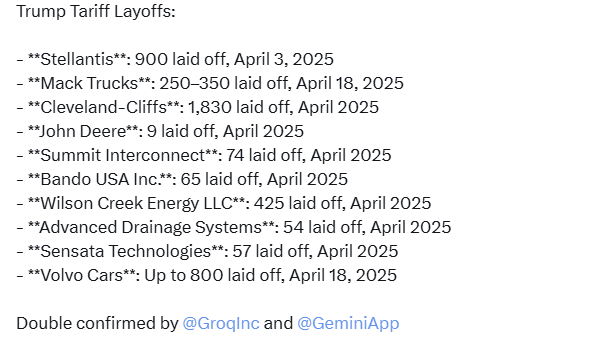
Which might be exactly why some are not waiting around to see the actual event.
We hope this does not lead to more announcements like this.
Mack Trucks fires 350 workers in Pennsylvania—CEO says “President Trump’s tariffs are the driving force.” Workers will receive no severance or benefits—company exploits loophole over so called “probationary period.” Local economy will lose $260.59 Million per year—2.9% of the region’s manufacturing GDP. Mack Trucks announced the laying off of 350 workers—10% of all employees—at its Lehigh Valley Operations facility in Lower Macungie Township, Pennsylvania. This could trigger 220 indirect job losses in the local supply chain due to a 20% reduction in supplier contracts—exacerbating the economic impact on the Lehigh Valley region.
They are not alone:
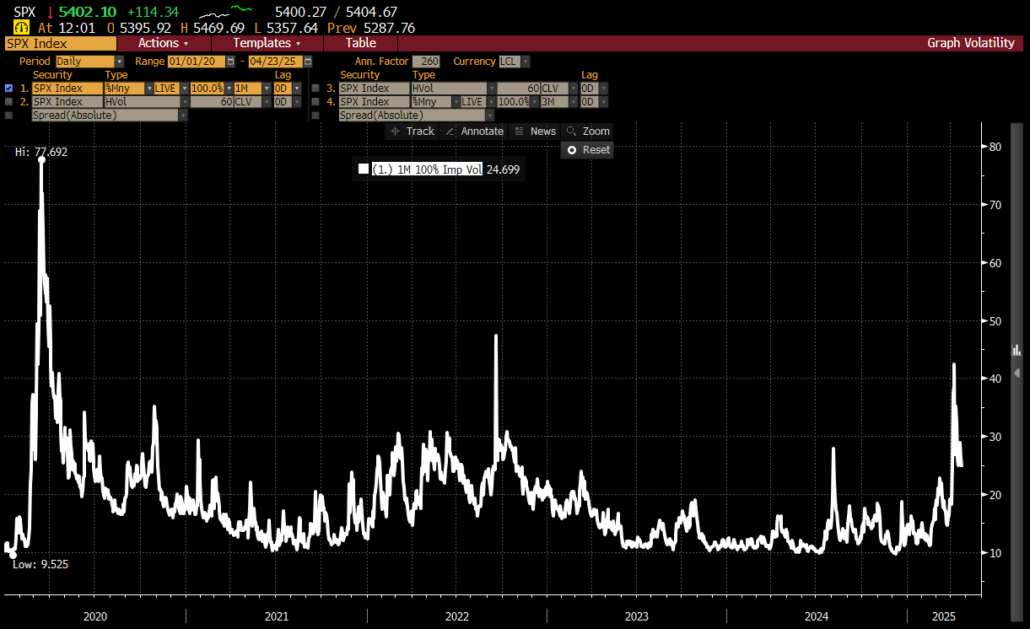
Maybe the Equity market is starting to sense this. At the time of this writing the SPX is looking to have one of its better weeks, but high realized vol is not exactly the type of foundation on which to build a confident bull market.
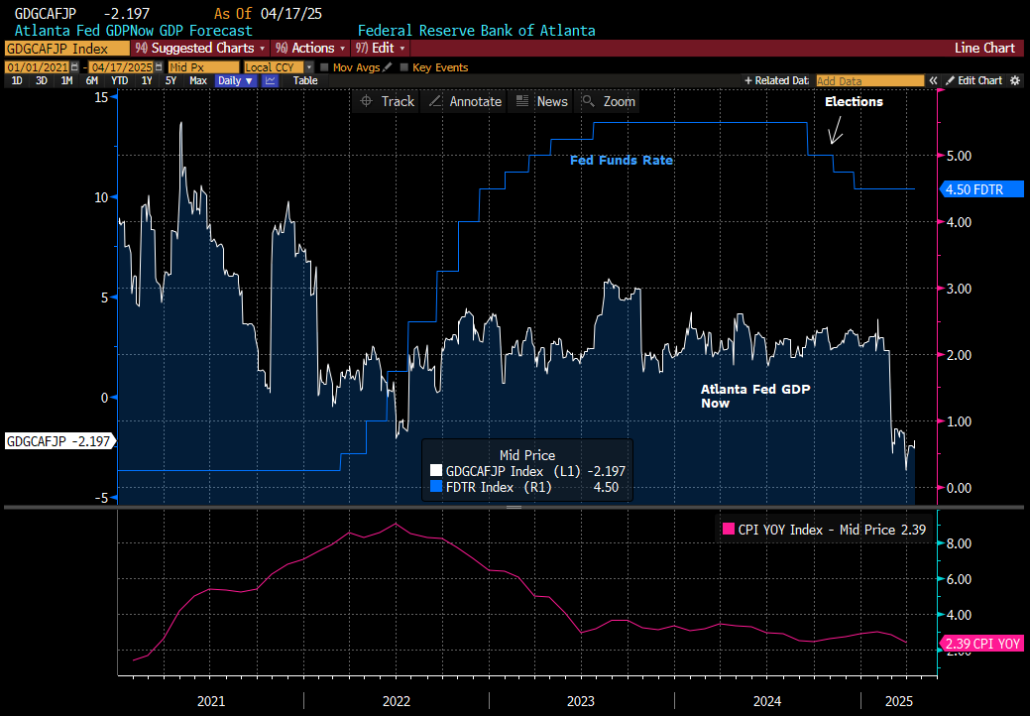
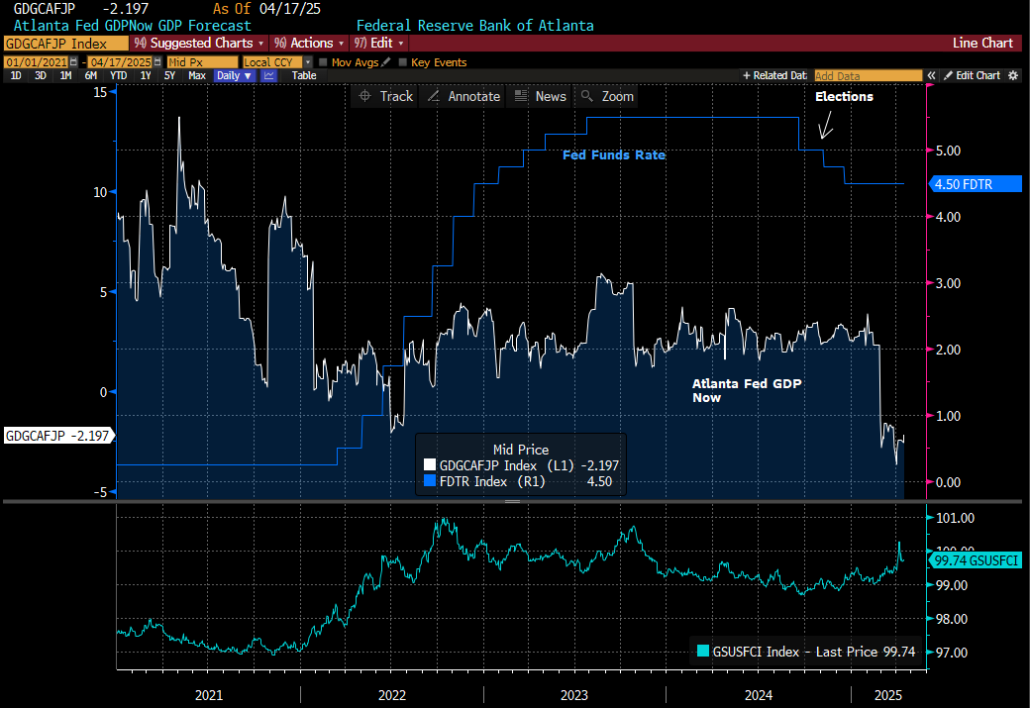
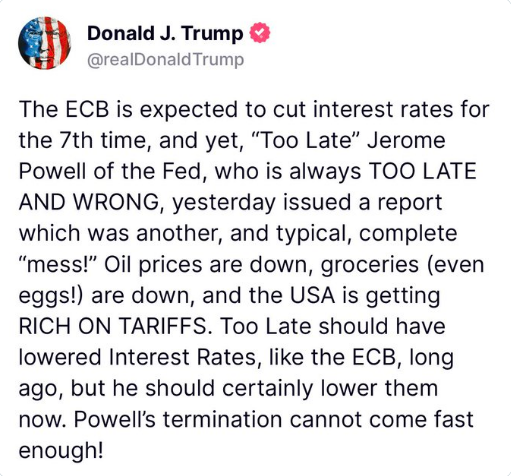
Fed Independence
A lot of talk about the “Independence” of the Federal Reserve recently. But if one looks at a picture of GDP and Fed funds rate a little different picture emerges…
The ”Independent” Fed cut rates 100bps while the Atlanta Fed GDP Now was in the 3.5% range, presently it is 500bps+ below that and we they are in we are data dependent stage?
For good measure adding CPI which is roughly at the same level or lower than when the 100bps of cuts began. 10/31/24 reading was 2.6%, while most recent is 2.4%.
Meanwhile the GS Financial Conditions Index showing that conditions are tighter as well.
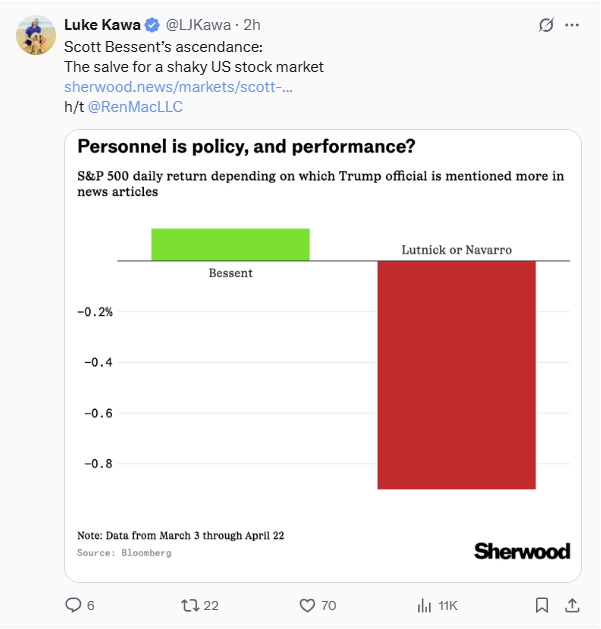
Favorite post
Self-explanatory
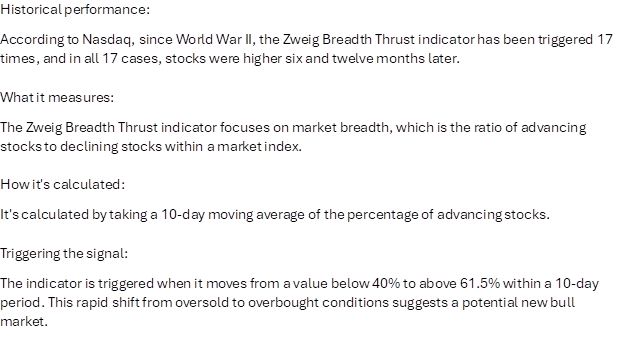
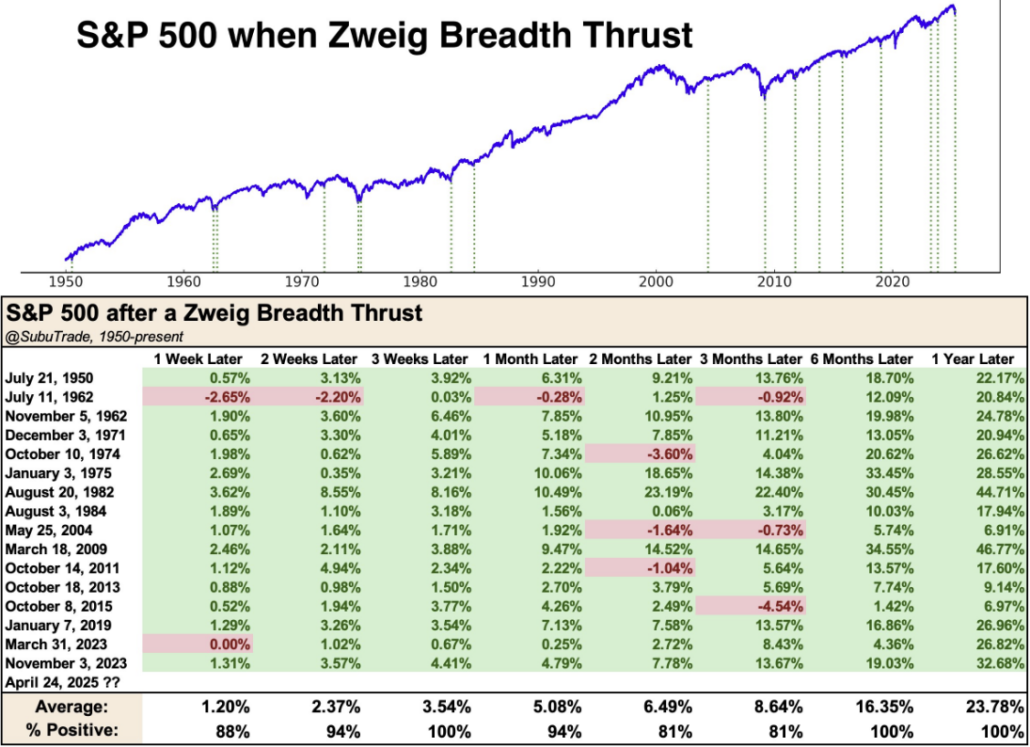
Most Popular
Most popular chart of the week?
What is the Zweig Breadth thrust?
Perspective
A gentle reminder of how crazy things can get:
Have a great weekend!
Best,
Meraki Trading Team
About Meraki Global Advisors
Meraki Global Advisors is a leading outsourced trading firm that eliminates investment managers’ implicit and explicit deadweight loss resulting from inefficient trading desk architectures. With locations in Park City, UT and Hong Kong, Meraki’s best-in-class traders provide conflict-free 24×6 global trading in every asset class, region, and country to hedge funds and asset managers of all sizes. Meraki Global Advisors LLC is a FINRA member and SEC Registered and Meraki Global Advisors (HK) Ltd is licensed and regulated by the Securities & Futures Commission of Hong Kong.
For more information, visit the Meraki Global Advisors website and LinkedIn page Contact: Mary McAvey VP of Business Development
https://merakiglobaladvisors.com/wp-content/uploads/2025/04/Meraki-Weekly-Trading-Digest-3.png16202880Meraki Global Advisorshttps://merakiglobaladvisors.com/wp-content/uploads/2021/03/meraki-logo-1.pngMeraki Global Advisors2025-04-25 22:34:312025-04-25 22:37:37Shipments/ Fed Independence/ Favorite Post/ Most Popular
A shortened holiday week which fortunately felt a bit less volatile in the markets, but not on the news flow side. Many consequential data points, but tying a cohesive narrative through them might be a bit of a stretch.
Nonetheless, we are going to give it a shot!
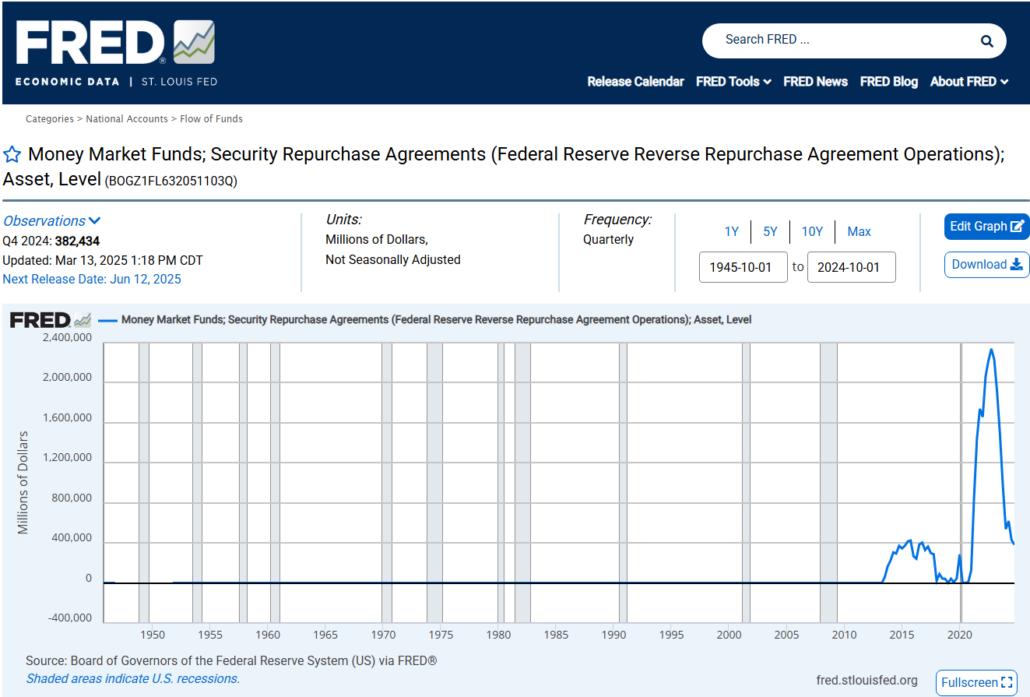
RRP’s
We start with the tweet that surprised nobody but traditional media could not help but focus on.
Whether the President can actually do this is yet to be seen, please note last week we mentioned that the path for such a move may have been paved with the recent SCOTUS decision.
This chart caught our eye this week, which we will explain if you indulge us briefly.
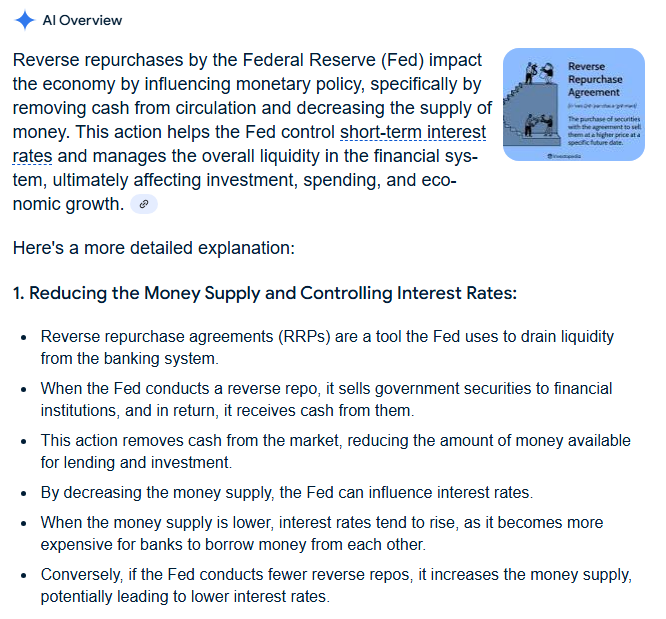
With a little help from Google, the definition of Reverse repurchase agreements:
The most significant point above we think is at the very bottom, “if the Fed conducts fewer reverse repos, it increases the money supply, potentially leading to lower interest rates.”
The chart above shows the level activity is certainly headed in the right direction, so we wonder if Chairman Powell is in fact trying to get ahead of further tweets like the one above?
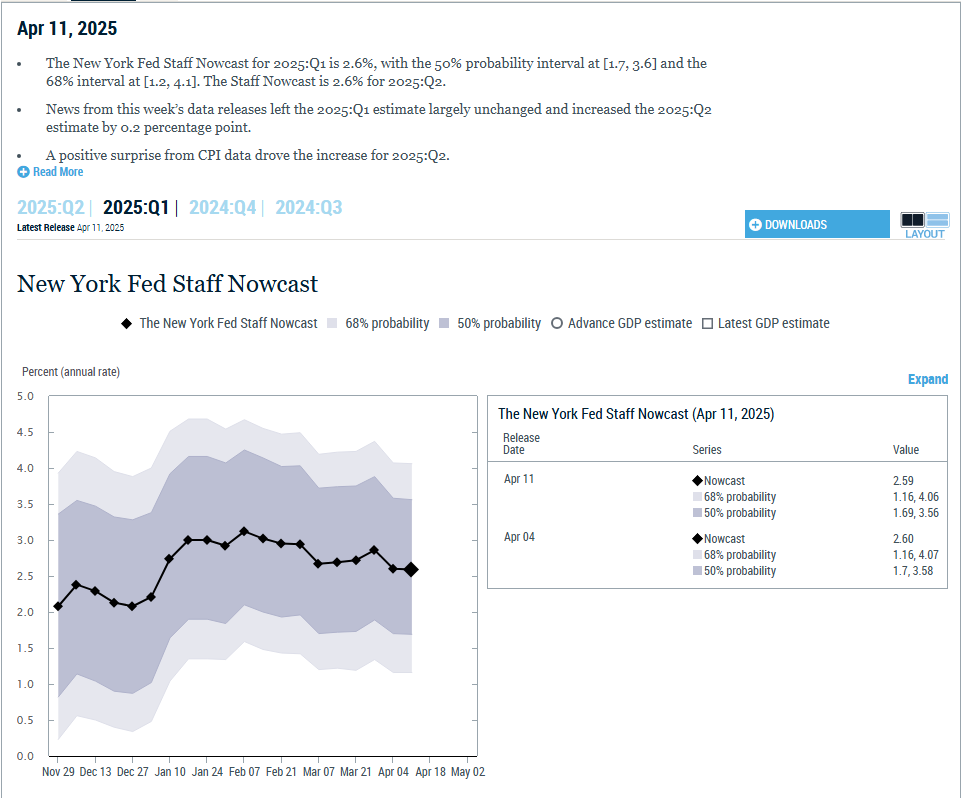
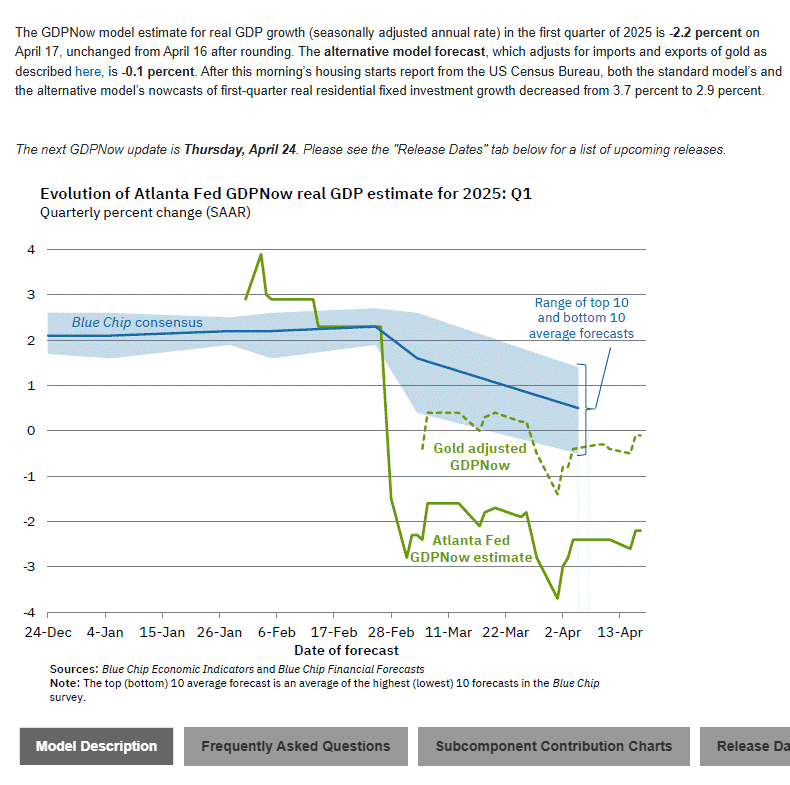
GDP
The great GDP debate continues. The battle between the Atlanta and New York Fed estimating the Q1 US GDP continues. The race ends April 30, 2025.
Presently the NY Fed is predicting the Q1 US GDP at 2.59% growth.
The Atlanta folks on the other hand see it below 0.
Regardless of which branch of the Federal reserve is correct, this is backward looking data.
We think more recent anecdotal data is piling up in favor of Atlanta.
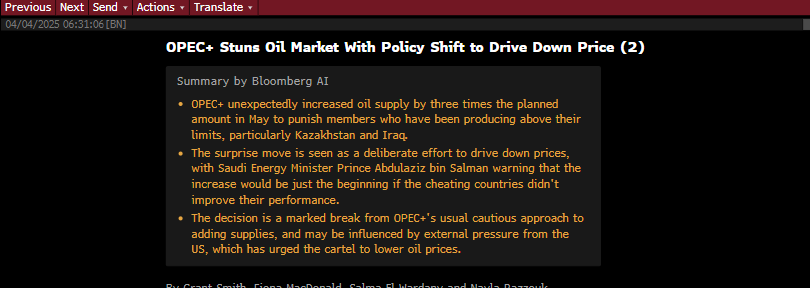
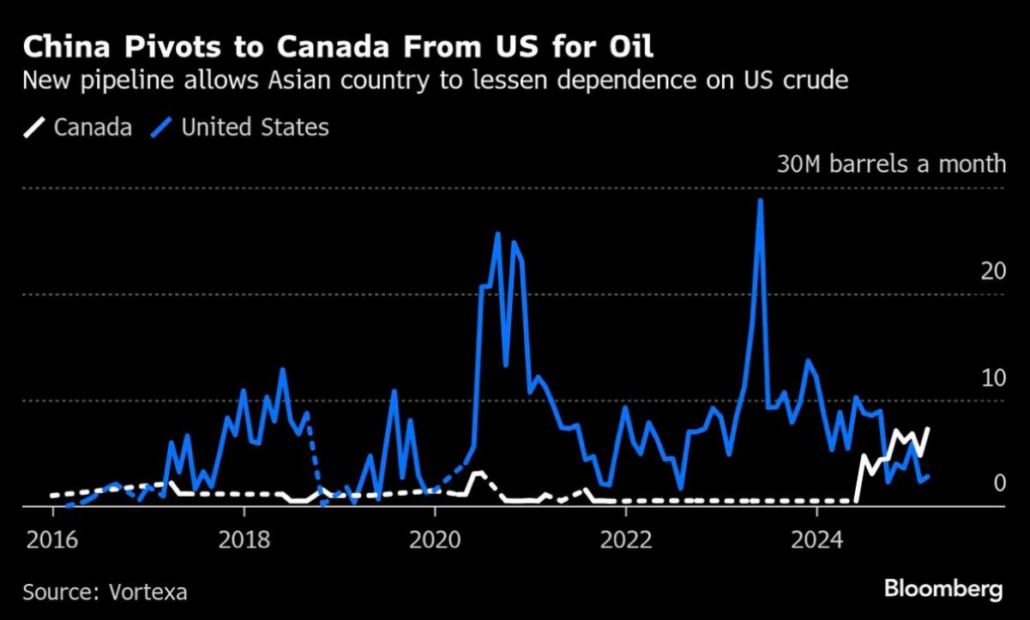
Chinese purchases of American oil are down -90% Y/Y, while Chinese purchases of Canadian oil are up +700% Y/Y. That’s a $20B annual loss for the United States at $60/barrel.
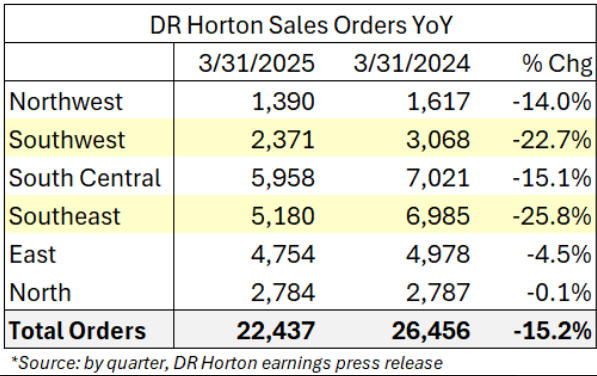
Home builders are beginning to show signs of cracking. DR Horton, America’s largest builder, just reported a 15% YoY contraction in sales orders. The largest contractions happened in the Southwest / Southeast, where sales dropped nearly 25%. A slowdown of this magnitude is a sign of decreasing consumer confidence and an oversupply of housing in America’s Sun Belt.
Which combined with this tweet:
Does not give one the warm and fuzzies around the residential home market.
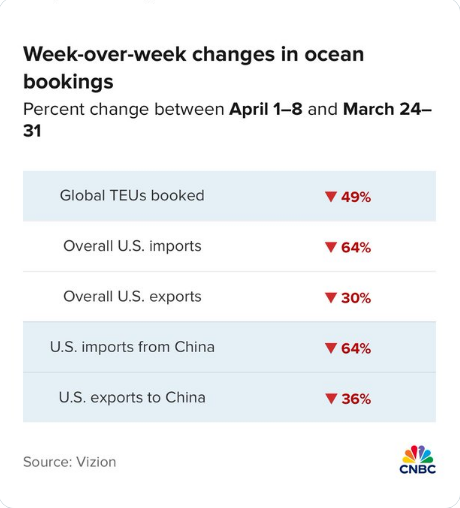
Recent shipping metrics, obviously not included in the backward looking Q1 GDP, have been falling off the ship.
Which will have quite the future impact on the domestic trucking industry.
But, it’s not just goods, its people too!
As we have presented before, the potential for a slower economy is manifesting itself in surveys, or the so called “soft data”.
Expectations and Sentiment direct from U of M website:
And this final chart sums it up the best, people across the earnings spectrum are simply not feeling good about the future, and that effects everyone’s’ spending habits.
Analysts are consumers as well, and we think this chart shows they sense, expect, feel it as well?
Citibank Earnings Revision Index
So, the NY Fed may be more accurate for the call April 30th, due to rear view mirror ability, but keeping one eye on the Atlanta peeps might serve investors well.
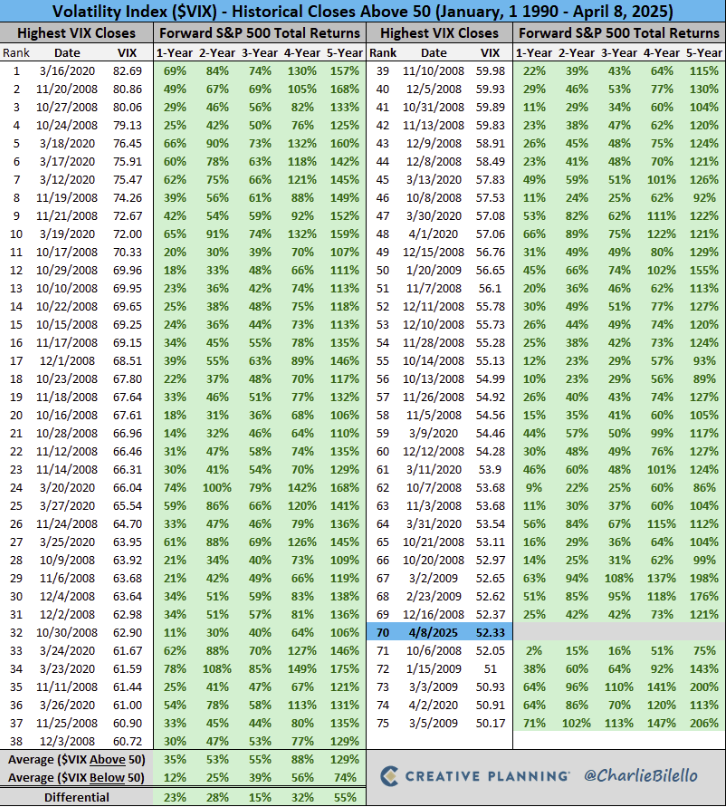
VIX
A good argument for putting $$ to work when the VIX Index goes north of 50?
We think an argument can be made that most of the data is heavily skewed to GFC and Covid, but heck the math is the math!
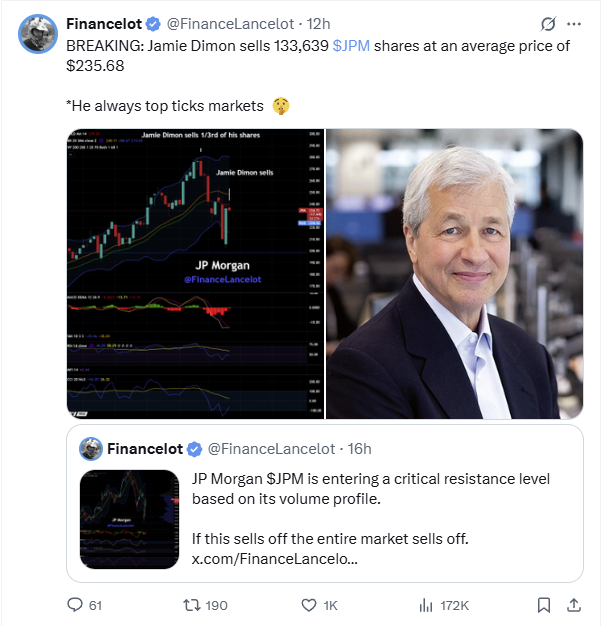
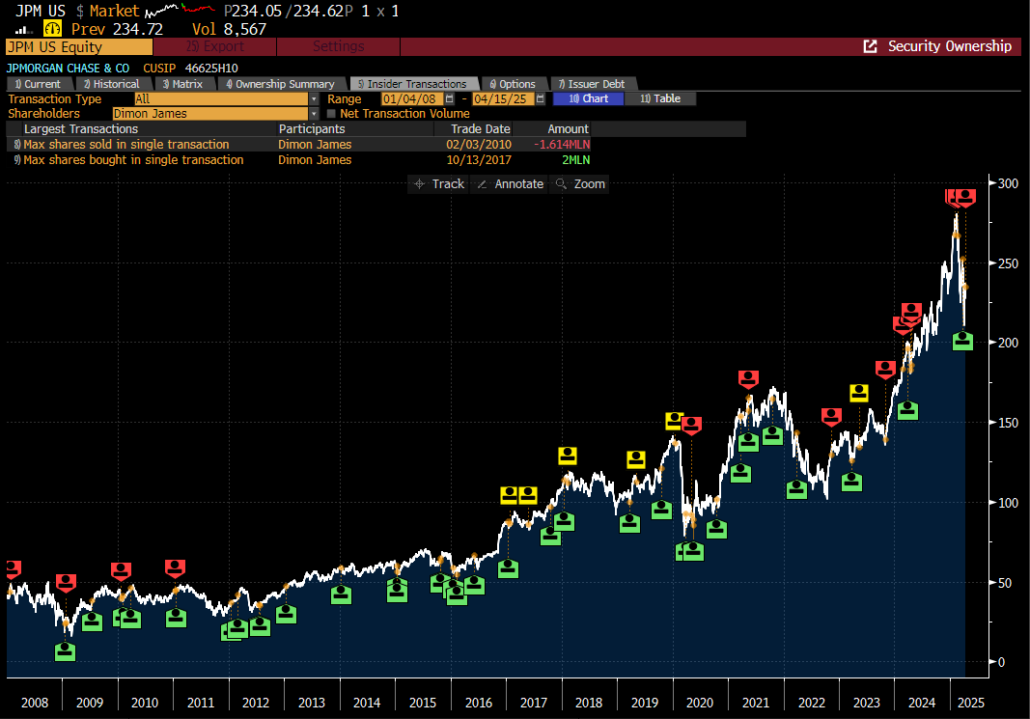
Jamie & Mark
Considering his age and amazing career we think it inevitable that there will be more posts like this in the future.
So, it made us wonder what his record of selling looks like.
We went through a rigorous methodical process to determine, he’s pretty good at this buying and selling stuff.
We would like to leave you with this, it’s a post from Mark Cuban. Rare to see him agree with POTUS, but for all our sake’s we hope they collaborate!
Meraki Global Advisors is a leading outsourced trading firm that eliminates investment managers’ implicit and explicit deadweight loss resulting from inefficient trading desk architectures. With locations in Park City, UT and Hong Kong, Meraki’s best-in-class traders provide conflict-free 24×6 global trading in every asset class, region, and country to hedge funds and asset managers of all sizes. Meraki Global Advisors LLC is a FINRA member and SEC Registered and Meraki Global Advisors (HK) Ltd is licensed and regulated by the Securities & Futures Commission of Hong Kong.
For more information, visit the Meraki Global Advisors website and LinkedIn page Contact: Mary McAvey VP of Business Development
https://merakiglobaladvisors.com/wp-content/uploads/2025/04/Meraki-Weekly-Trading-Digest-1.png16202880Meraki Global Advisorshttps://merakiglobaladvisors.com/wp-content/uploads/2021/03/meraki-logo-1.pngMeraki Global Advisors2025-04-18 00:21:392025-04-18 00:21:41The Tweet/ GDP Estimates/ VIX/ Jamie & Mark/ Next weeks earnings
Let’s take a step back and look at some basic charts.
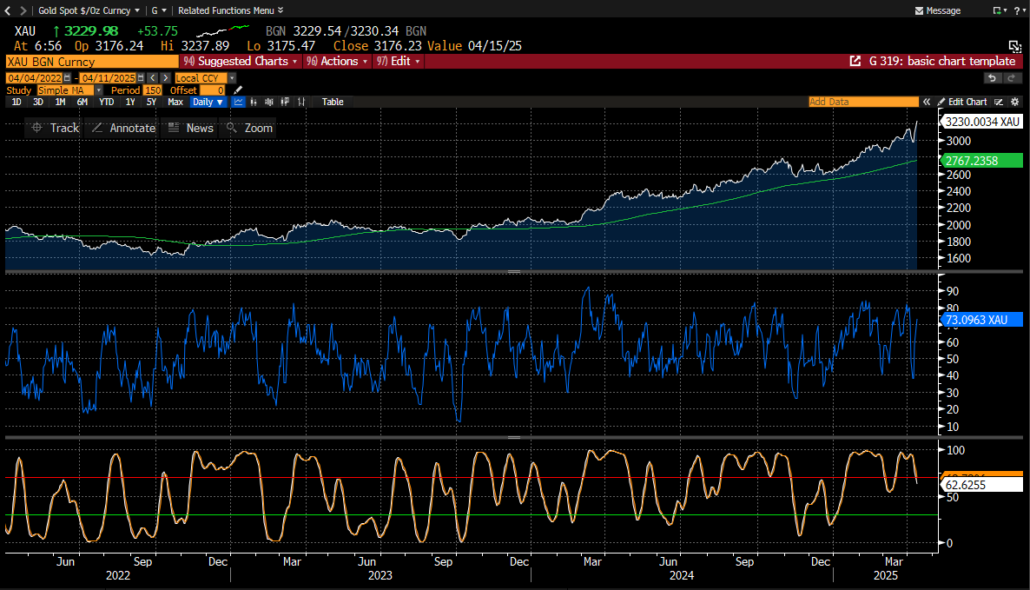
Gold
Breaking out and all-time highs in $ terms:
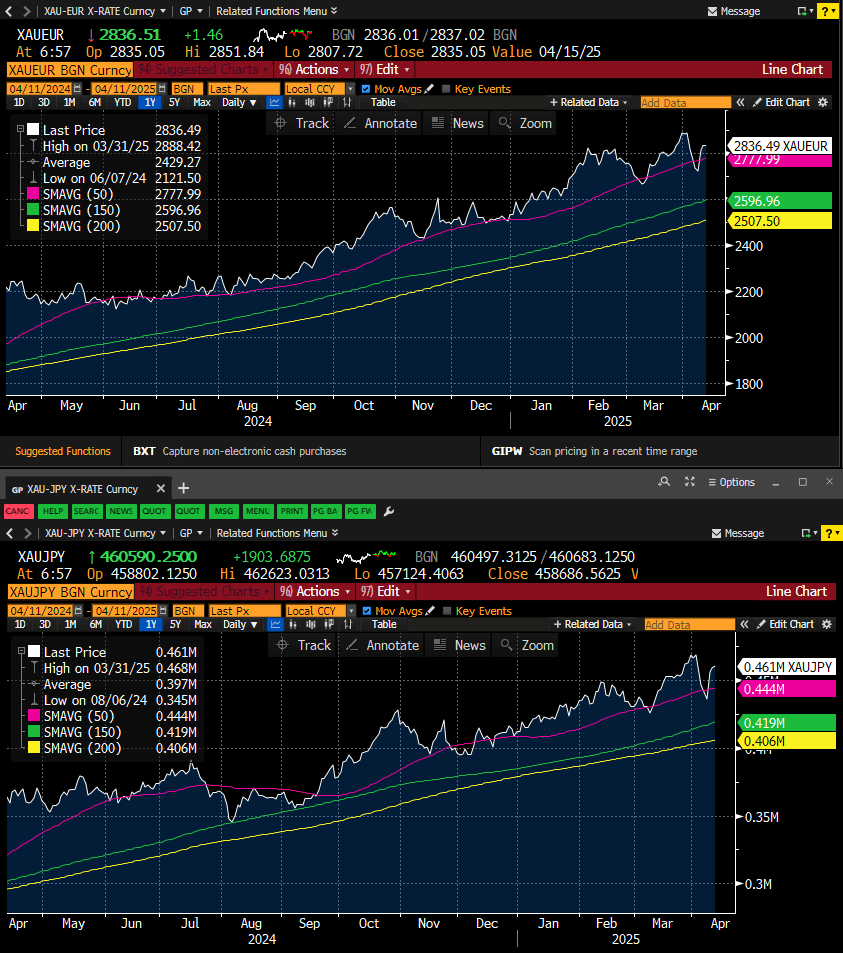
But, in Euro or Yen terms it is not:
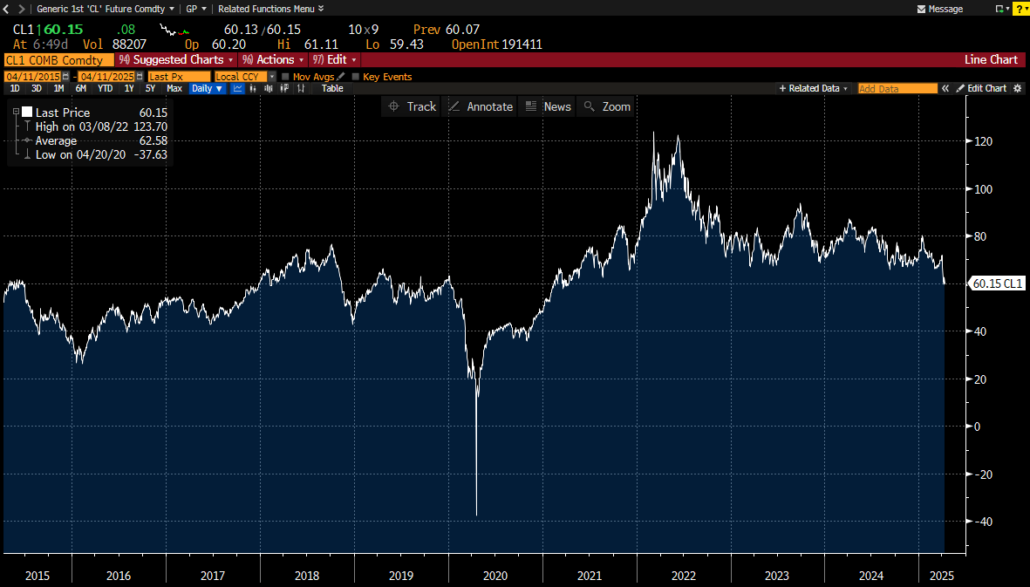
Crude
Looks to be breaking down:
Meanwhile, no flight to safety:
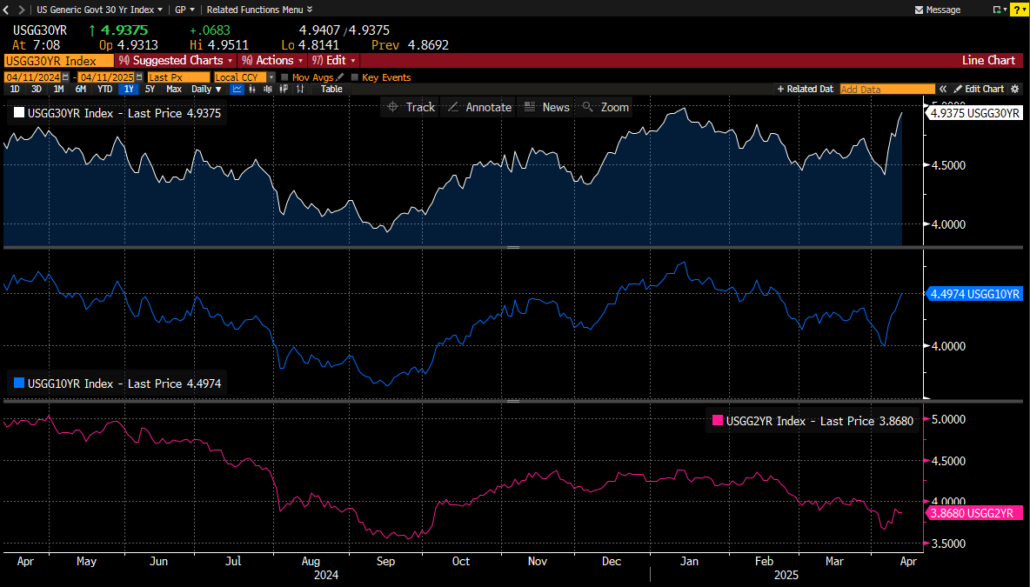
Treasuries, 30yr, 10yr, and 2yr below, not at highs, on a yield basis, but much closer than one would think with the action in Gold and Crude.
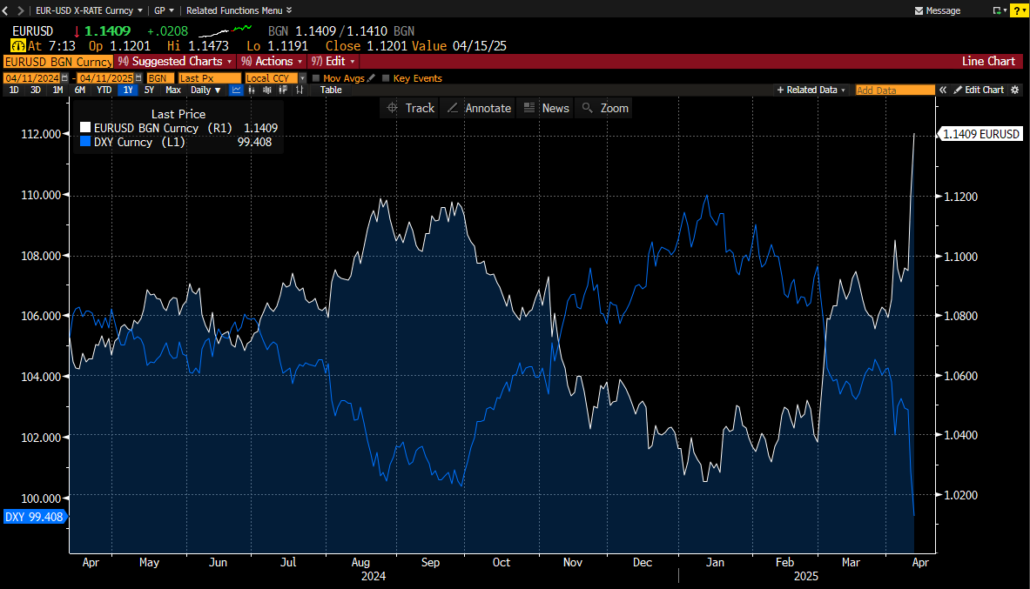
So, what is the issue? Looks to be credibility in the $, or more bluntly stated, is the world losing confidence in the United States?
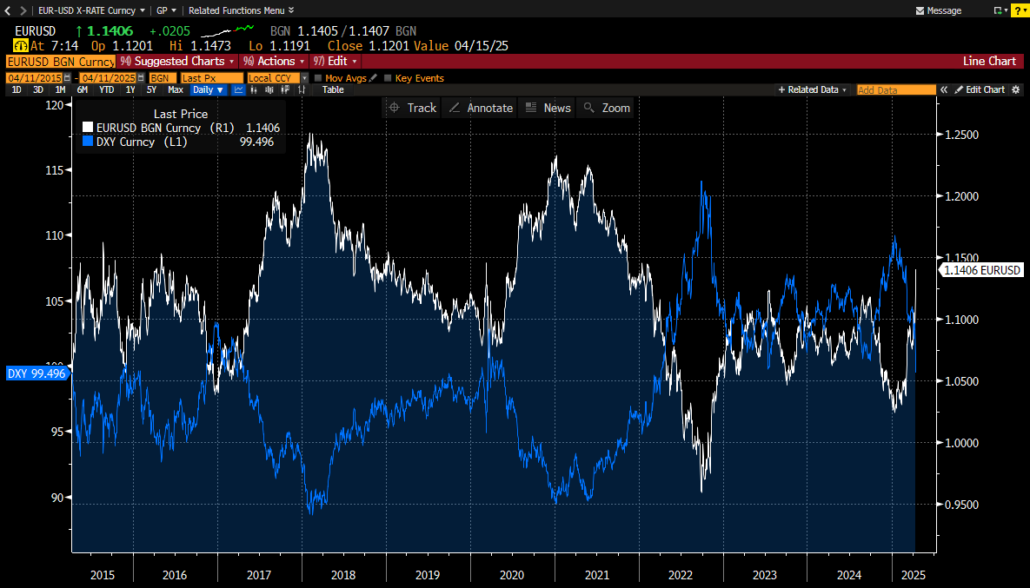
Before we get overly concerned about the juxtaposition of this chart, let’s take a longer look back.
As shown above, we are not in uncharted territory, especially considering who had just won the Presidency in November 2016.
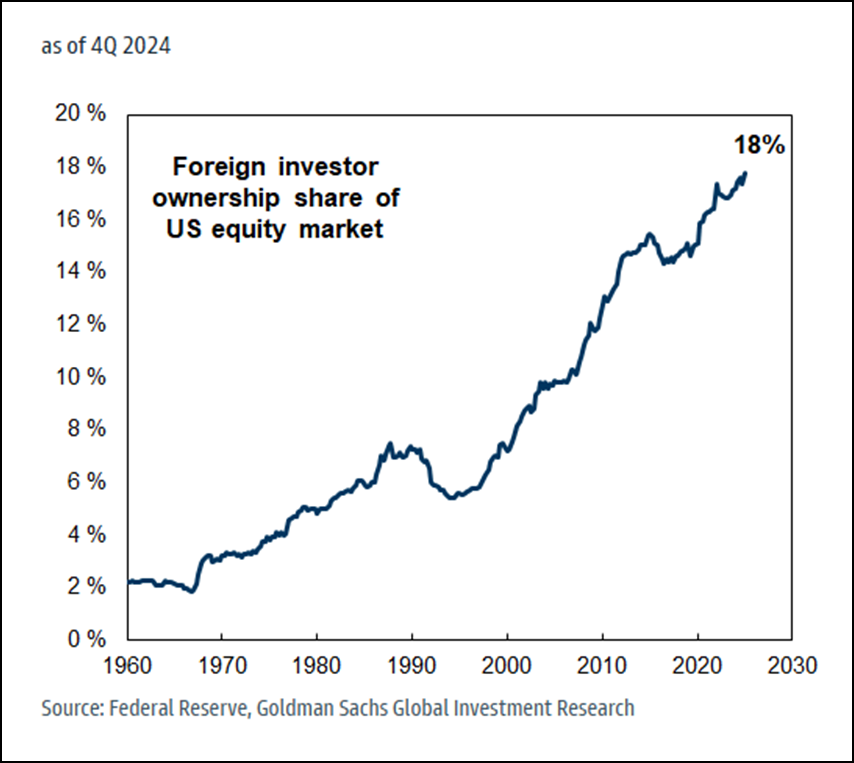
But, as usual, it’s all about context. And heading into this recent period the US Equity market was trading at a premium valuation, some believe, because of “American Exceptionalism”.
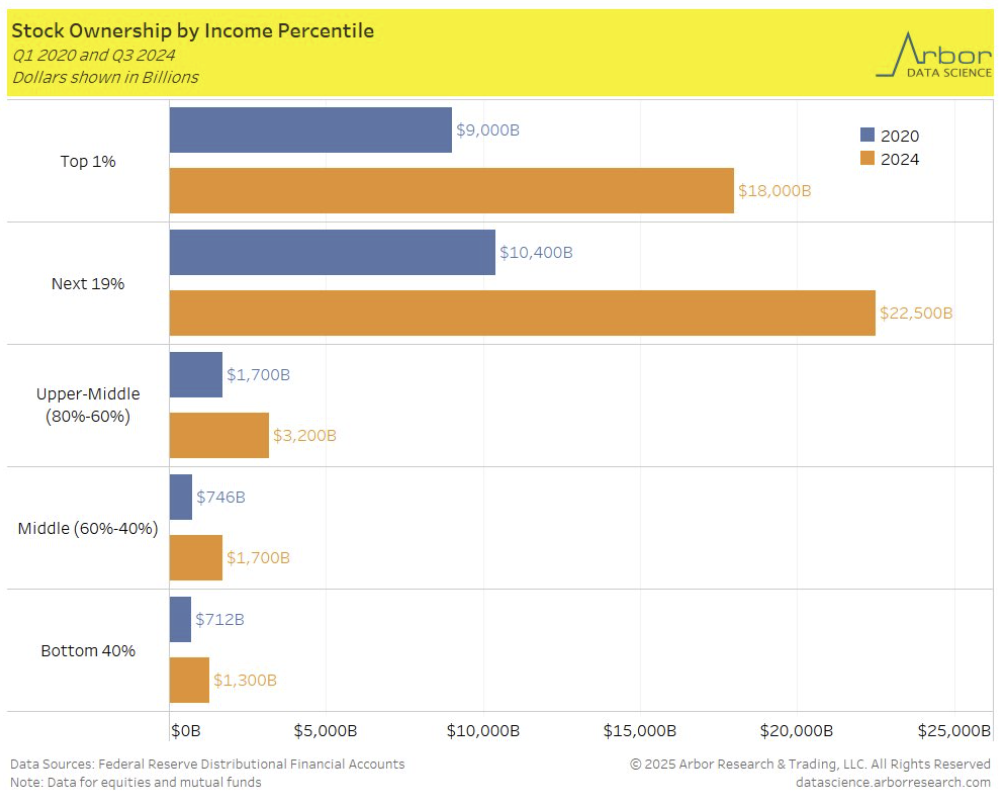
According to the below chart, Foreign Investors own 18% of the US stock market. GS is suggesting they have seen heavy supply from this community, specifically in Mag 7, banks, and industrials. If this investor base is questioning the US exceptionalism thesis (and currently in the process of cutting their portfolio’s overall weighting dedicated towards US equities) then there may still be more selling to come.
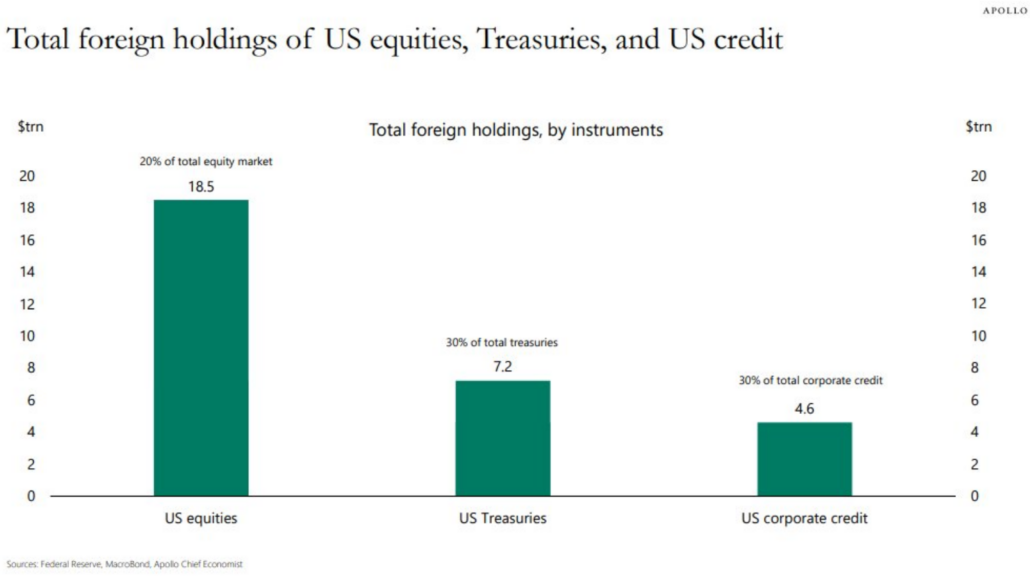
To put this in a different perspective, Foreigners own $19 trillion in US equities, $7 trillion in Treasuries, and $5 trillion in US credit, see chart below.
That corresponds to 20% of US equities, 30% of Treasuries, and 30% of credit outstanding. – Apollo
Recent equity volumes would suggest that all investors were running for the checkout lines at the same time.
Listed below are the eleven occasions that US market has seen over 20b share volume days.
Out of these eleven days, 3 were major ‘index rebalance’ days. So only 8 days really matter. Out of the 8 that matter, 6 have been during the last 7 trading days.
Below:
4/9/2025 = 30.493b shares
4/7/2025 = 29.097b shares
4/4/2025 = 26.623b shares
4/10/2025 = 23.847b shares
1/27/2021 = 23.674b shares
12/20/2024 = 23.508b shares (rebalance day)
4/8/2025 = 23.475b shares
3/21/2025 = 21.035b shares (rebalance day)
4/3/2025 = 20.925b shares
1/7/2025 = 20.842b shares (DeepSeek reaction? Mag7 was hit hard)
9/20/2024 = 20.807b shares (rebalance day)
So, yes, there could easily be more selling pressure to come in each of the 3 buckets above, but with respect to equities should we really think it possible Foreign sellers will be selling the market closer to a bottoming multiple than a premium one?
Closer we get to a 17X, it becomes harder to believe that selling will be taking place simply for the sake of liquidation. Rational market theory would suggest otherwise.
As we all know, all it takes is one tweet about a Chinese deal and a large rally could easily manifest in the US equity market.
SCOTUS Risk
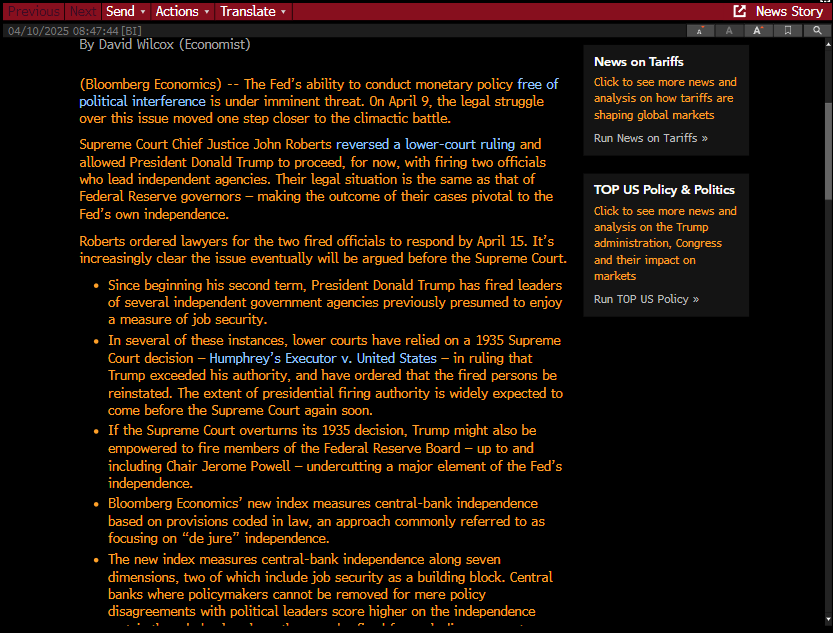
Only because of the exceptional volatility did we not lead with the below article this week. This easily could be the most impactful market event in years if it plays out as described below.
See the 3rd bullet point:
It may be a stretch, but could the potential politicalization of the Federal Reserve be contributing to the loss of confidence in the US markets/”American Exceptionalism”?
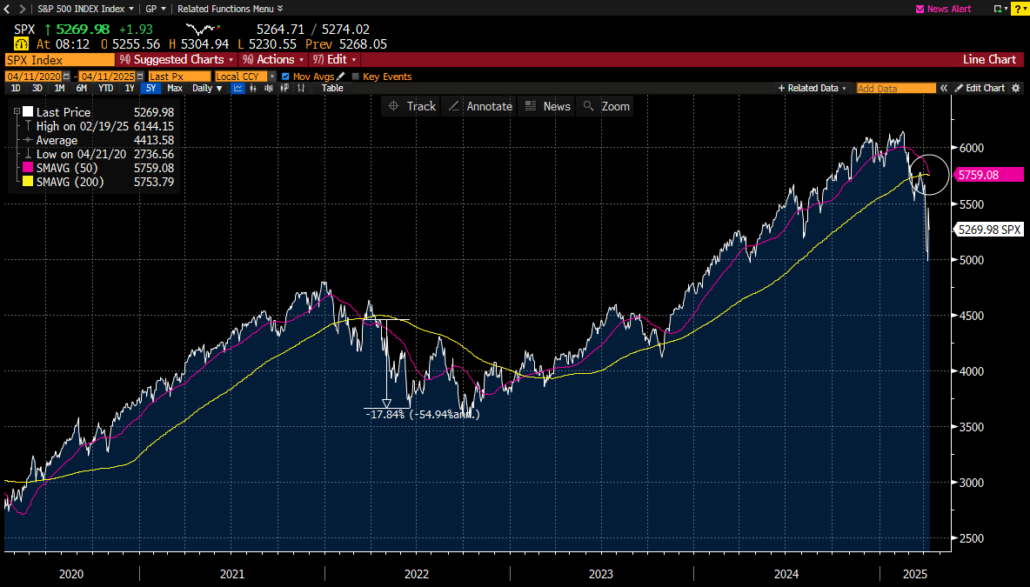
Death Cross
Should we be concerned that the death cross is imminent?
The last time we experienced the 50 day Moving average travel below the 200 day was early 2022, and it resulted in an almost 18% pull back in the SPX Index.
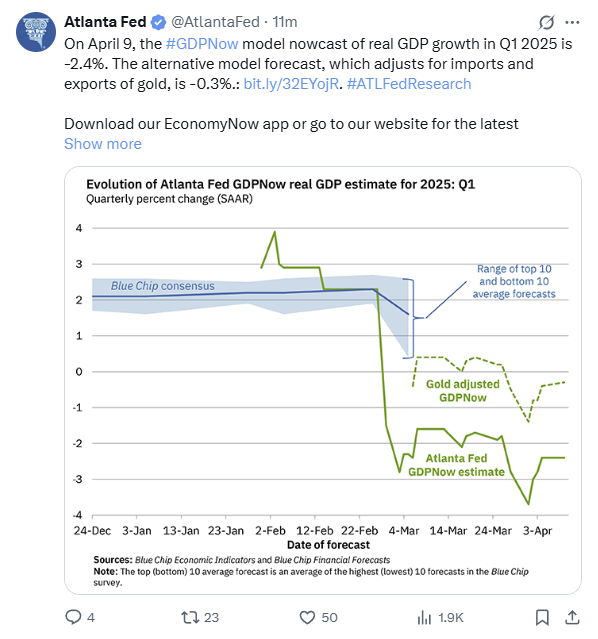
2 Differentiated Metrics
We have alluded to both of these metrics previously. They both would seem to indicate the real economy is slowing faster than other Marco metrics suggest.
The first is the Atlanta Fed GDP Now forecast. It presently has Q1 GDP coming in negatively.
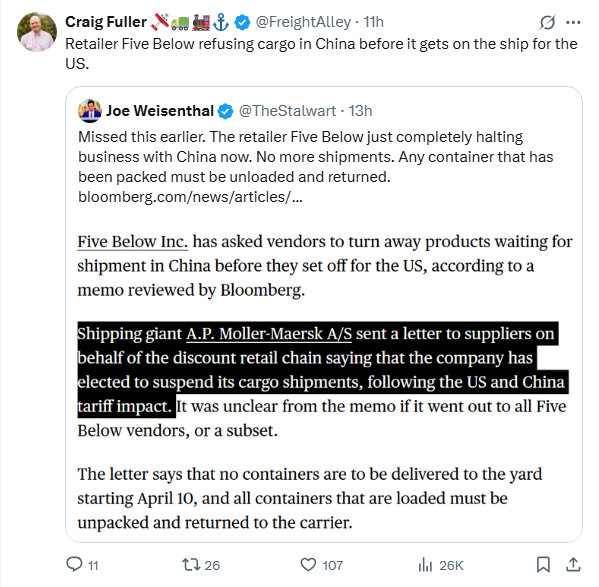
We mention this because we are now hearing/seeing anecdotal information related to the tariffs that suggest commerce is freezing up.
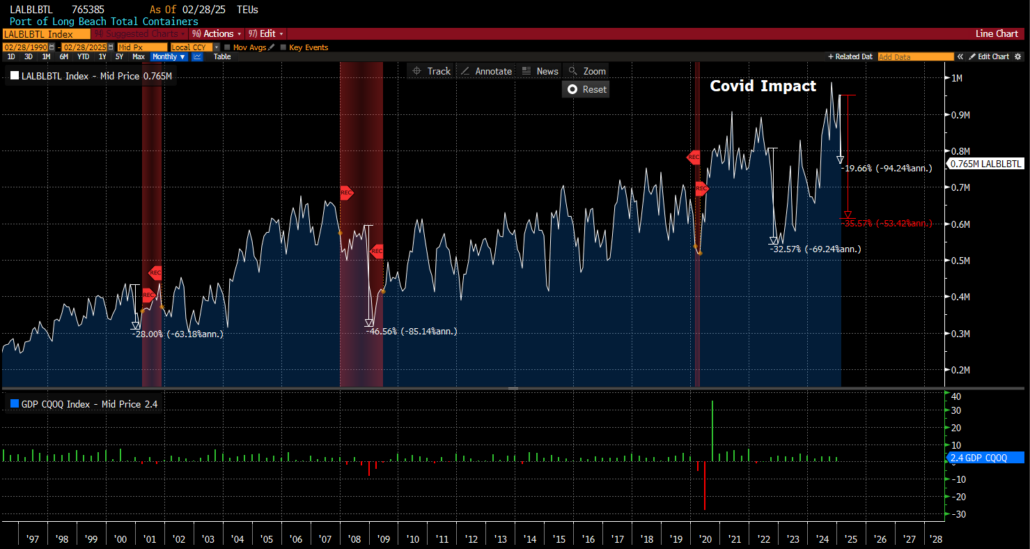
So, yes, this is only one example. But, we heard the CEO of the long beach port interviewed earlier this week on CNBC. His call was that 2H 2025 volumes could slow by anywhere from 10% to 20%.
We wanted to see what they looked like YTD already.
As shown above, volumes are already down 19% YTD, so another 10 to 20% would place them in line with previous periods where in fact a Recession did occur as those volumes slid closer to 30% down.
Making the Atlanta GDP Now metric all that more plausible.
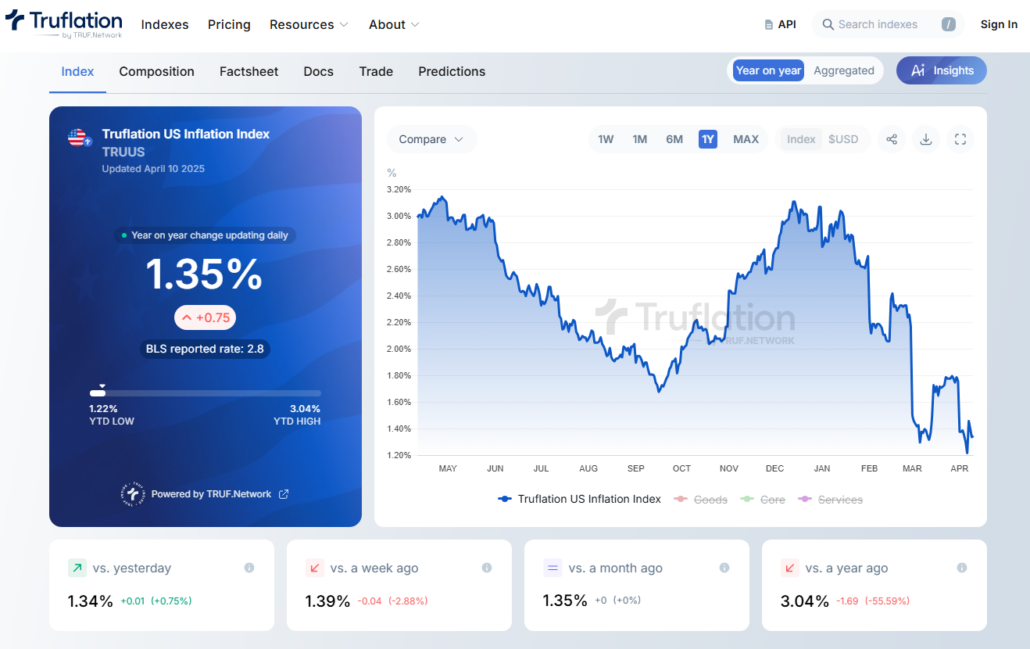
The other differentiated metric we keep an eye on is a little more off the beaten path, but we think it may start to pick up some more credibility in the near future.
The YoY CPI came in at 2.4%. Two months ago the Truflation metric had their call at 2.42%. So, we are starting to wonder whether this metric is a helpful read on forthcoming CPI reports. If so, one could easily argue that the Federal Reserve’s dual mandate may be down to just a focus on one going forward.
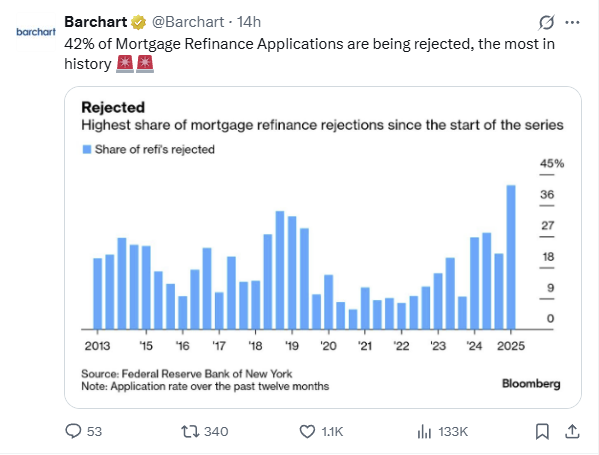
We sure hope that is the case, because the higher rates for longer is only continuing to freeze the Home buyer’s market.
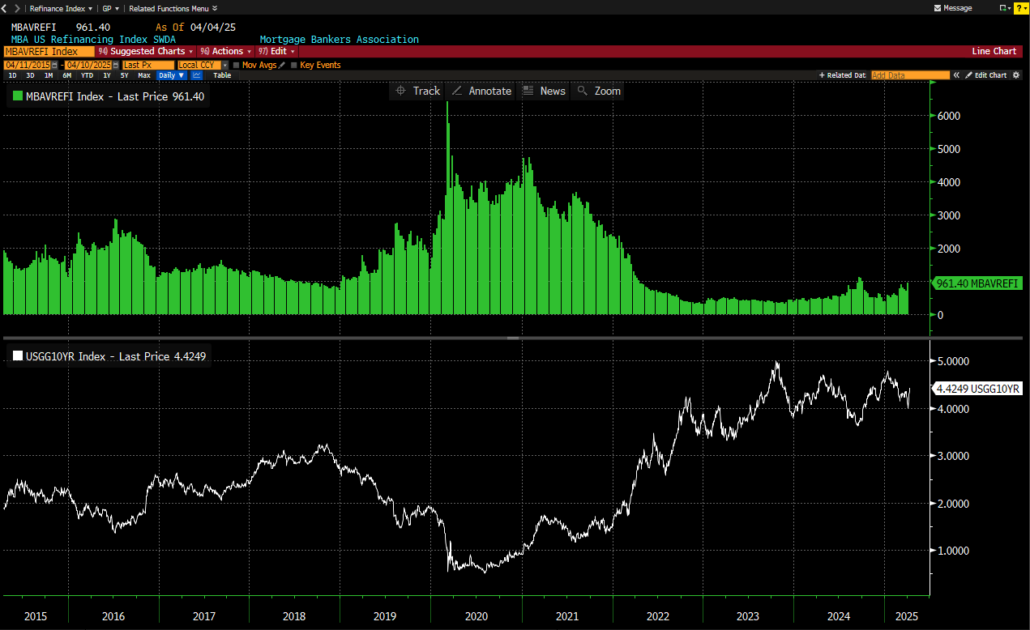
According to the Federal Reserve Bank of NY, 42% of mortgage refi applications are rejected.
To put refi’s in context, below is a chart showing how they are presently only 25% of the high levels in 2020, and half the levels in 2016 pre pandemic. Yet with yields higher, the 10yr TSY is the lower panel around 4.4%, it certainly does not look like this market will come to aid a falling US GDP in any way.
Meraki Global Advisors is a leading outsourced trading firm that eliminates investment managers’ implicit and explicit deadweight loss resulting from inefficient trading desk architectures. With locations in Park City, UT and Hong Kong, Meraki’s best-in-class traders provide conflict-free 24×6 global trading in every asset class, region, and country to hedge funds and asset managers of all sizes. Meraki Global Advisors LLC is a FINRA member and SEC Registered and Meraki Global Advisors (HK) Ltd is licensed and regulated by the Securities & Futures Commission of Hong Kong.
For more information, visit the Meraki Global Advisors website and LinkedIn page Contact: Mary McAvey VP of Business Development
https://merakiglobaladvisors.com/wp-content/uploads/2025/04/Meraki-Weekly-Trading-Digest-2.png10801920Meraki Global Advisorshttps://merakiglobaladvisors.com/wp-content/uploads/2021/03/meraki-logo-1.pngMeraki Global Advisors2025-04-11 22:27:172025-04-11 22:37:55American Exceptionalism/ SCOTUS Risk/ Death Cross/ Differentiated Metrics/ 2 Final Thoughts
When market volatility explodes there is no shortage of content floating around. We thought going back to some simple basic charts for perspective might be helpful.
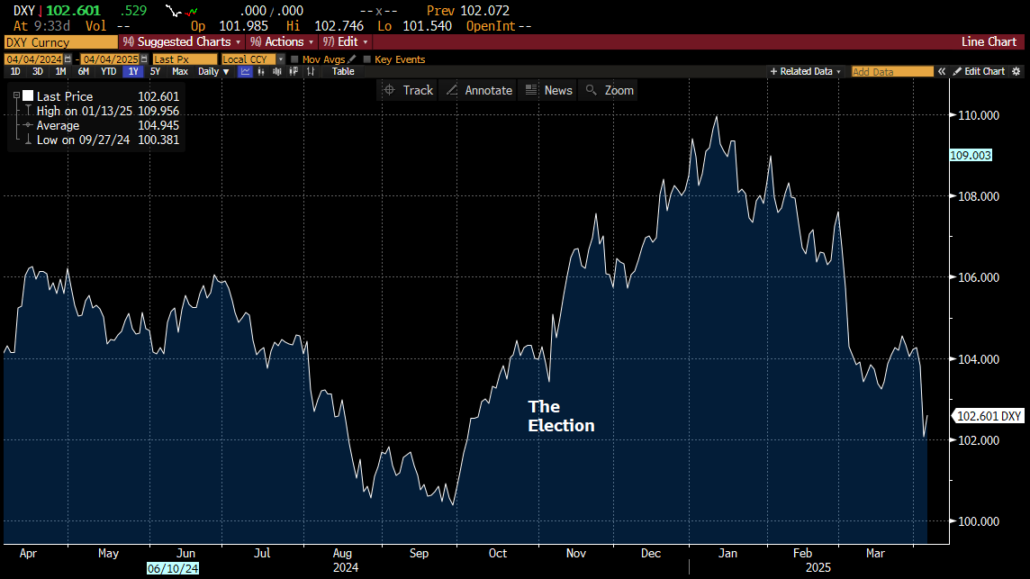
The $ has now round tripped its election move.
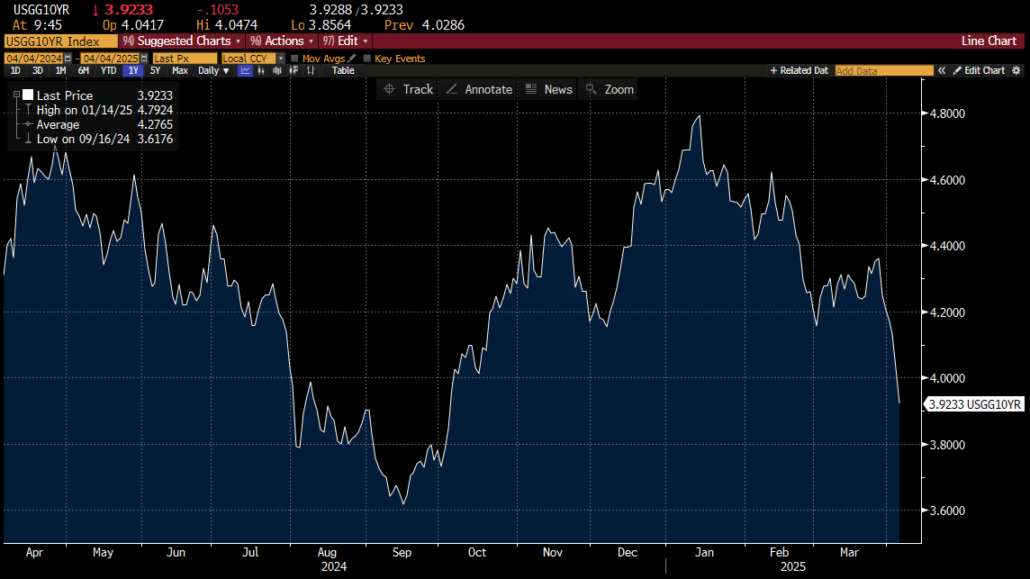
The 10yr TSY.
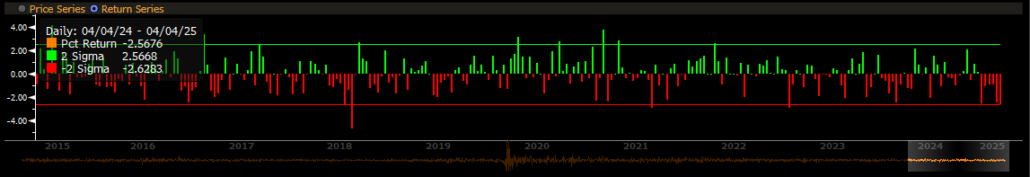
Adding HRH, Historical Return Histogram below as well, to show magnitude of recent moves.
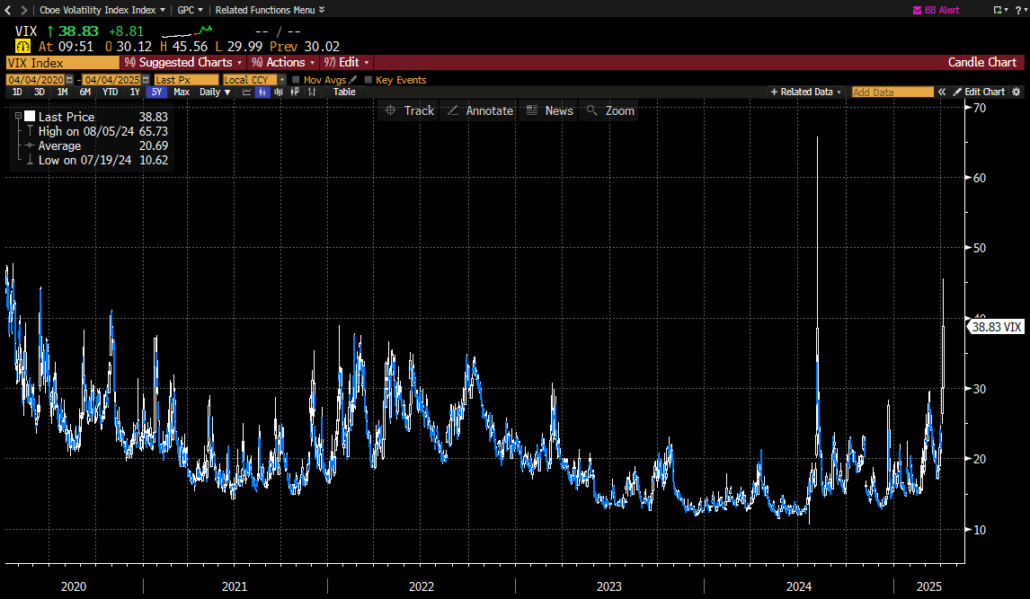
The VIX Index. With the introduction of ODTE options, some could argue the importance of this fear gauge has been slightly diminished, but we certainly think its still worth watching.
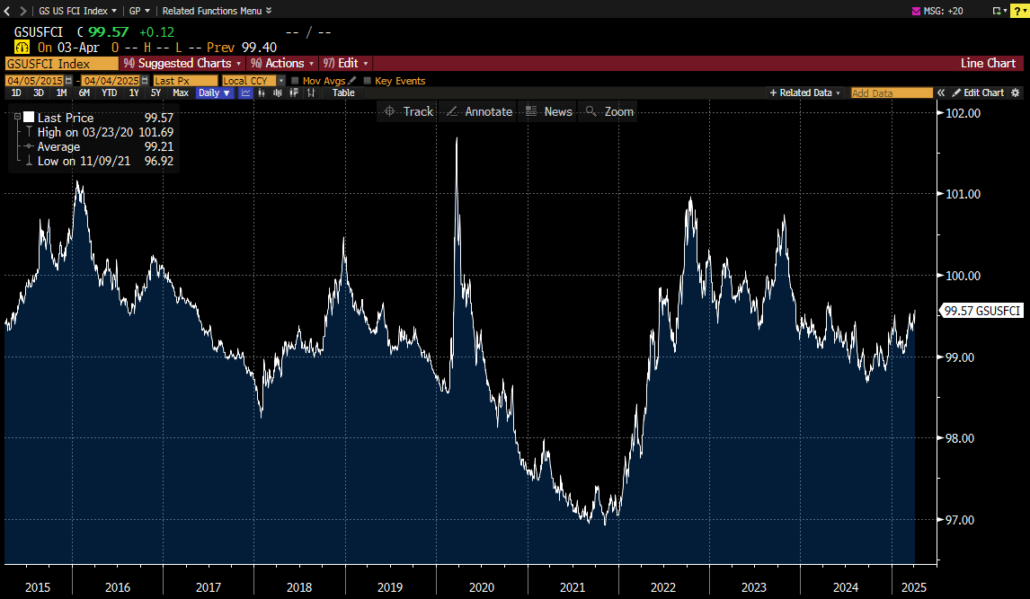
Goldman Sachs Financial Conditions Index. Unfortunately, there is still room for this Index to move higher, and thus financial conditions could certainly still get tighter from here.
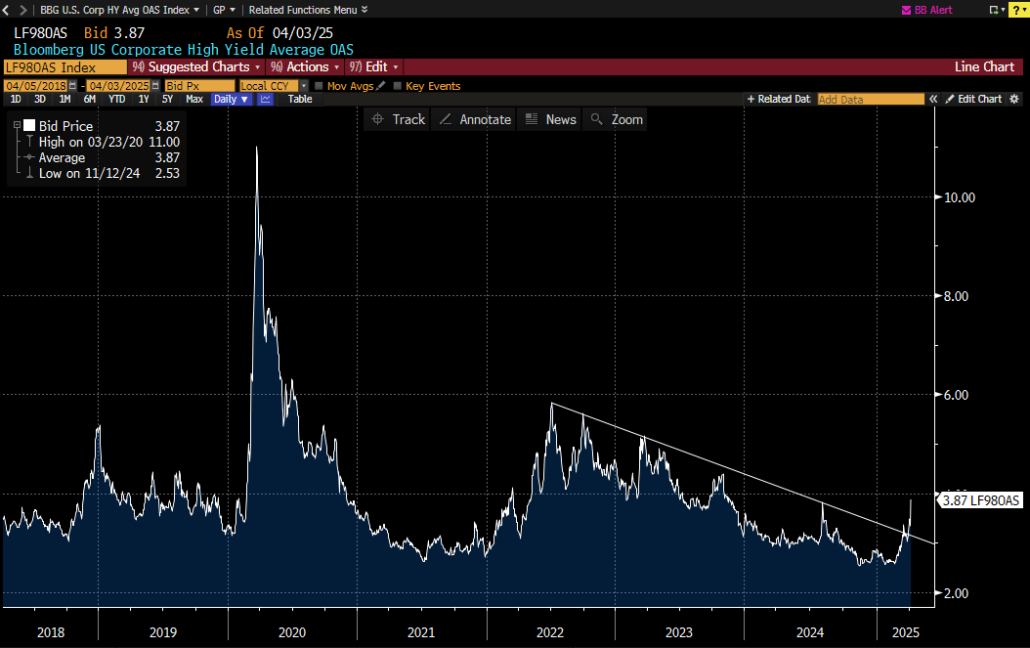
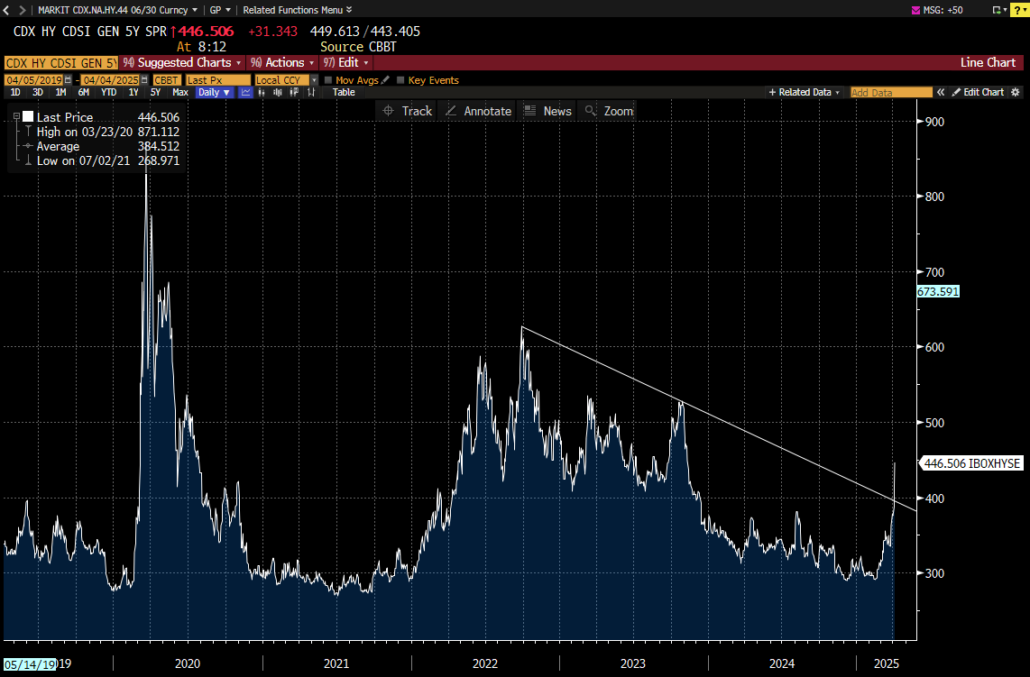
High Yield & CDS
Bloomberg US Corporate High Yield Average OAS
Surpassing August 2024 highs.
CDX HY CDSI GEN 5Y SPR:
As shown above both indices appear to be breaking from a down trend.
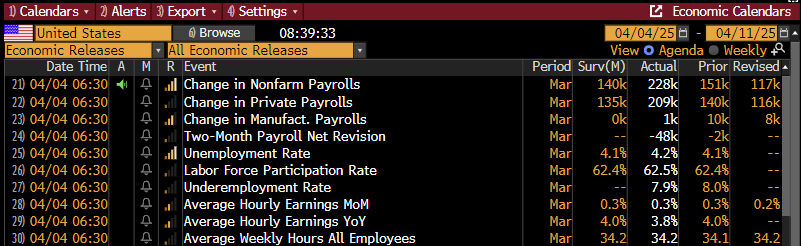
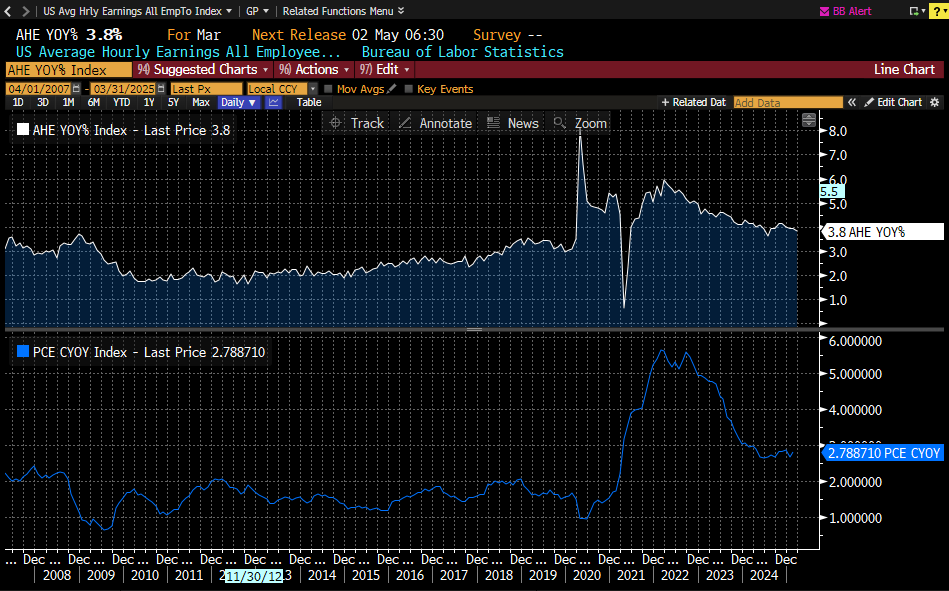
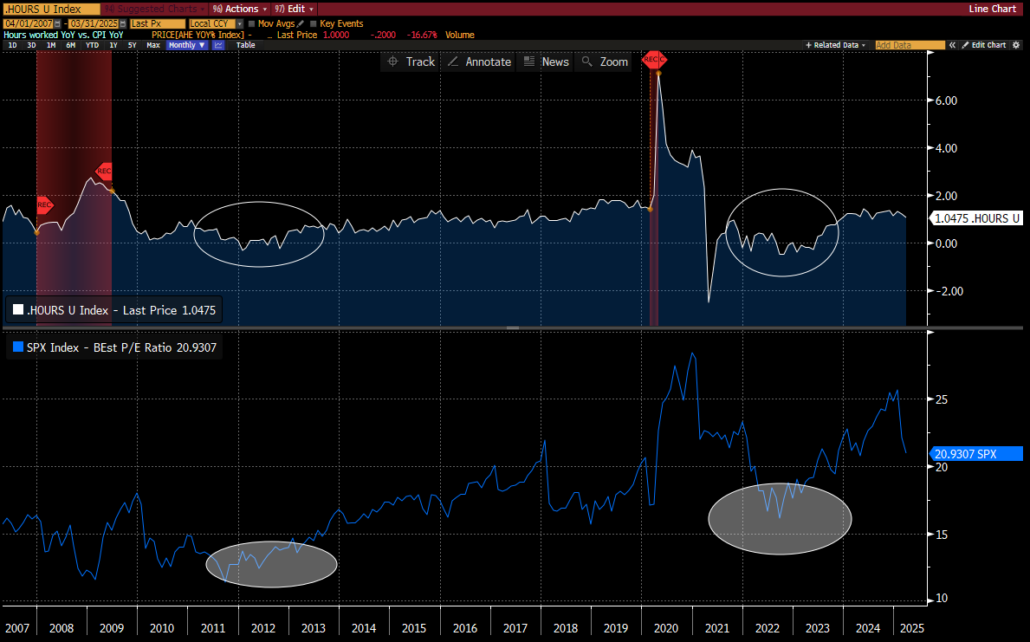
Hard to believe that Nonfarm Payroll release would take a back seat to any market impactful news, but today it most certainly did. Along with the Nonfarm payroll release come Hourly earnings metrics.
We wanted to look into the relationship between the Average Hourly earnings YoY and the Federal Reserve’s choice inflationary measure, Core PCE YoY.
Respective charts:
If we make the above 2 metrics a ratio, AHE YoY – PCE CYoY, we will generate the below chart in the top panel.
If the declining trend in average hourly wage growth continues the white line will continue moving lower. A concern is that the Core PCE is expected to move higher at the same time, most likely driving the white line down to or below 0. As shown above, when this ratio dips below that level, the Forward multiple on the SPX settles in somewhere between 12 and 17X usually. Still a long way from the most recent level of close to 21X.
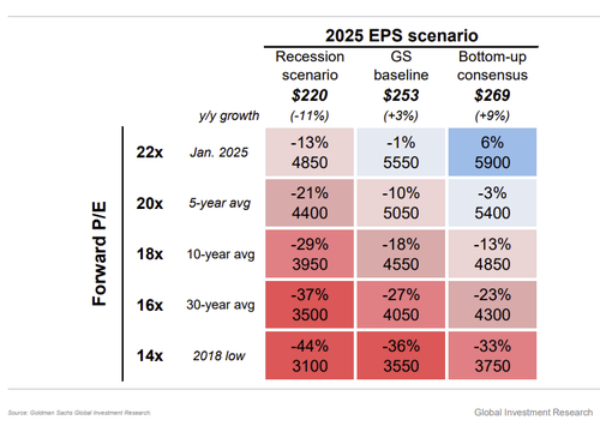
Goldman Sachs addresses the impact of lower multiples as well in their scenario metric below.
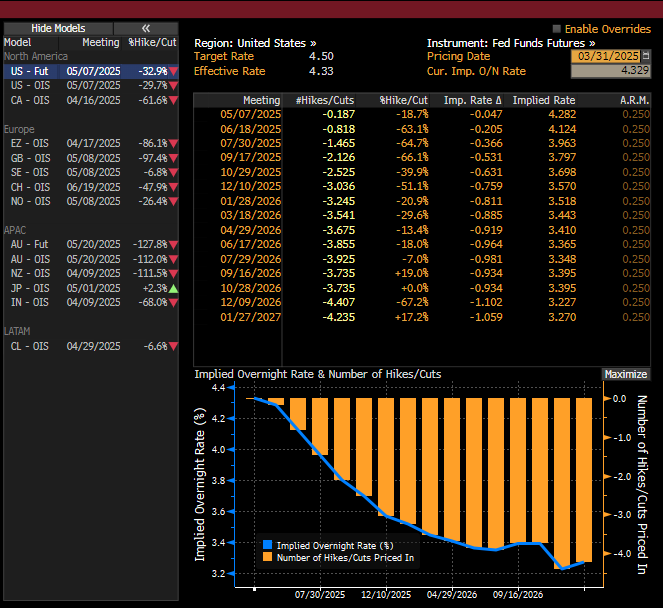
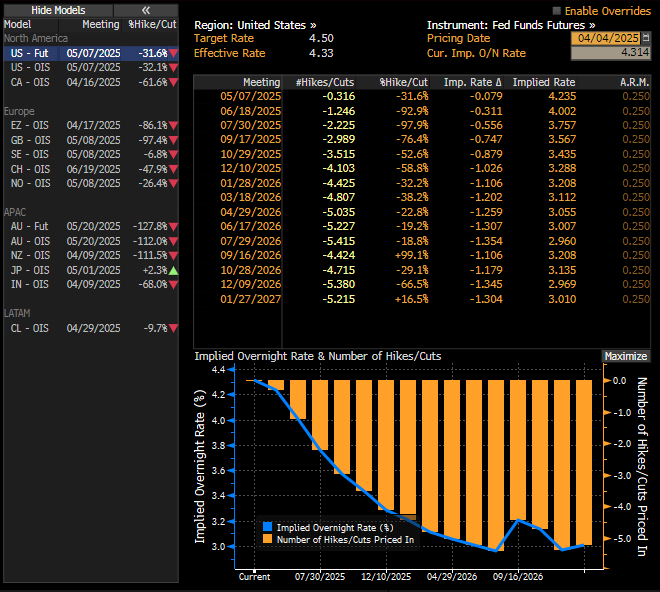
This week’s impact on the Fed futures market.
Looking at the 12/10/2025 meeting below, it suggests 3 cuts as of Monday, March 31st.
Fast forward to today, Friday, April 4th that number moves to 4+ cuts now.
Chairmen Powell just finished speaking at a schedule engagement a little while ago. His message was simple: the Fed is in a great spot to sit back and see what happens with the tariff impact AND THEN determine what action to take.
Well, as shown by the WIRP page above, the market is starting to think differently.
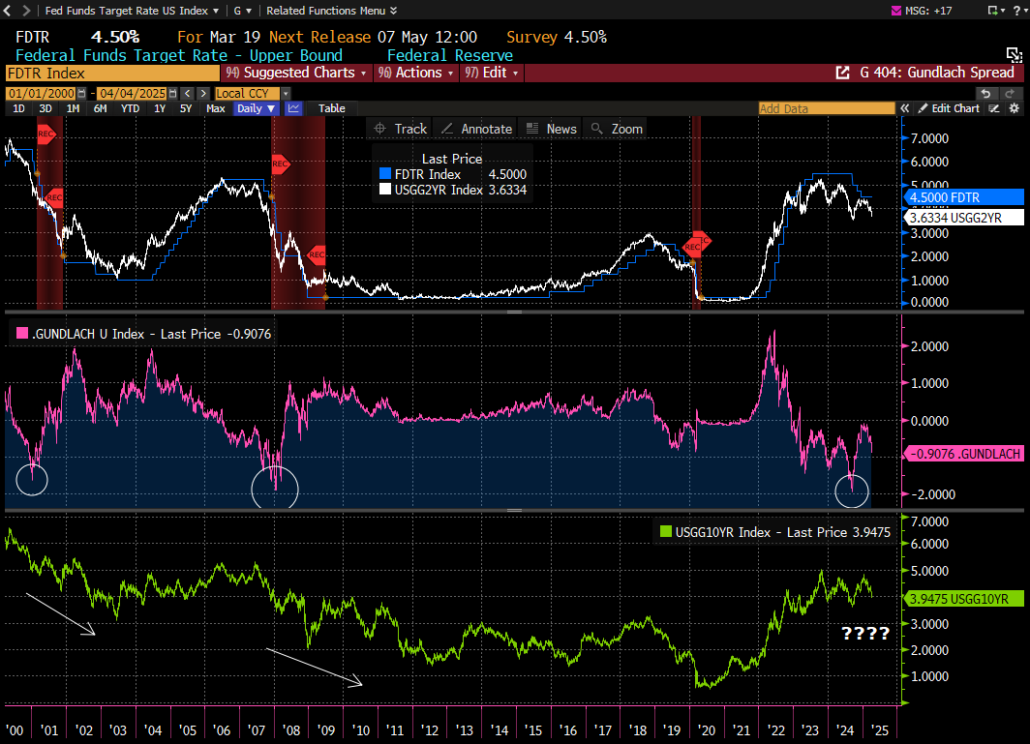
There has always been a belief that the Fed follows the direction of the 2yr TSY, if it moves to far away from the Fed Funds rate, eventually the Fed must simply catch up.
Well, below we chart this thesis. The top panel has both the 2yr TSY and the Fed Funds rate. The middle panel contains the spread of those 2 constituents. The bottom panel contains the 10yr TSY. If the 2yr TSY continues to move lower, it would seem reasonable to assume the Fed will have to follow.
Have a great weekend!
Best,
Meraki Trading Team
About Meraki Global Advisors
Meraki Global Advisors is a leading outsourced trading firm that eliminates investment managers’ implicit and explicit deadweight loss resulting from inefficient trading desk architectures. With locations in Park City, UT and Hong Kong, Meraki’s best-in-class traders provide conflict-free 24×6 global trading in every asset class, region, and country to hedge funds and asset managers of all sizes. Meraki Global Advisors LLC is a FINRA member and SEC Registered and Meraki Global Advisors (HK) Ltd is licensed and regulated by the Securities & Futures Commission of Hong Kong.
For more information, visit the Meraki Global Advisors website and LinkedIn page Contact: Mary McAvey VP of Business Development
https://merakiglobaladvisors.com/wp-content/uploads/2025/04/Meraki-Weekly-Trading-Digest.png10801920Meraki Global Advisorshttps://merakiglobaladvisors.com/wp-content/uploads/2021/03/meraki-logo-1.pngMeraki Global Advisors2025-04-04 22:33:162025-04-04 22:41:51Couple Charts to run through
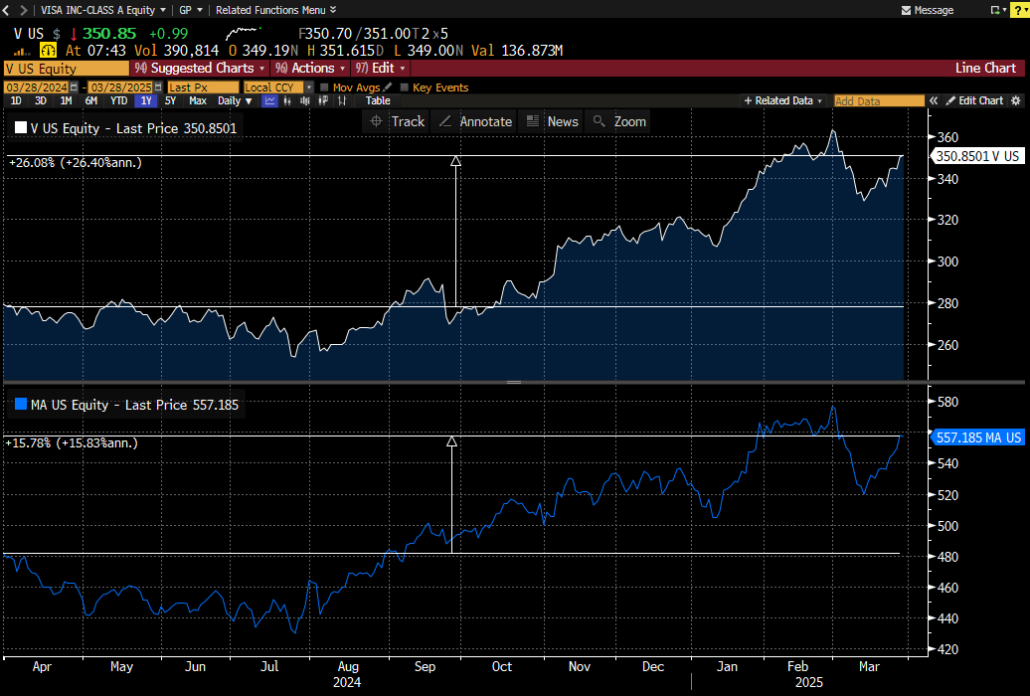
Historically the consumer represents about 2/3rds of the nation’s gross domestic product. So, one would think that understanding the state of the consumer would help provide guidance for navigating the equity markets?
If we start with spending, the consumer appears solid. Simplest way to look at this would be to view the stock performance of Visa or Mastercard.
Over the preceding 52 weeks, both names are performing well, up 26% and 16% respectively.
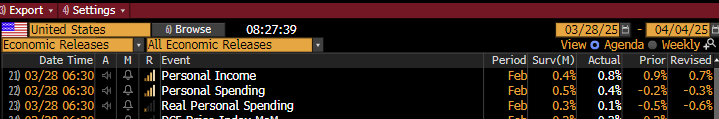
The Economic data on Income and Spending, reported today, also show that the consumer is on solid footing:
But, “Real” personal spending, or in other words “inflation adjusted”, shows some signs of weakness, with a negative previous print that was also revised lower, and a miss of the estimate today.
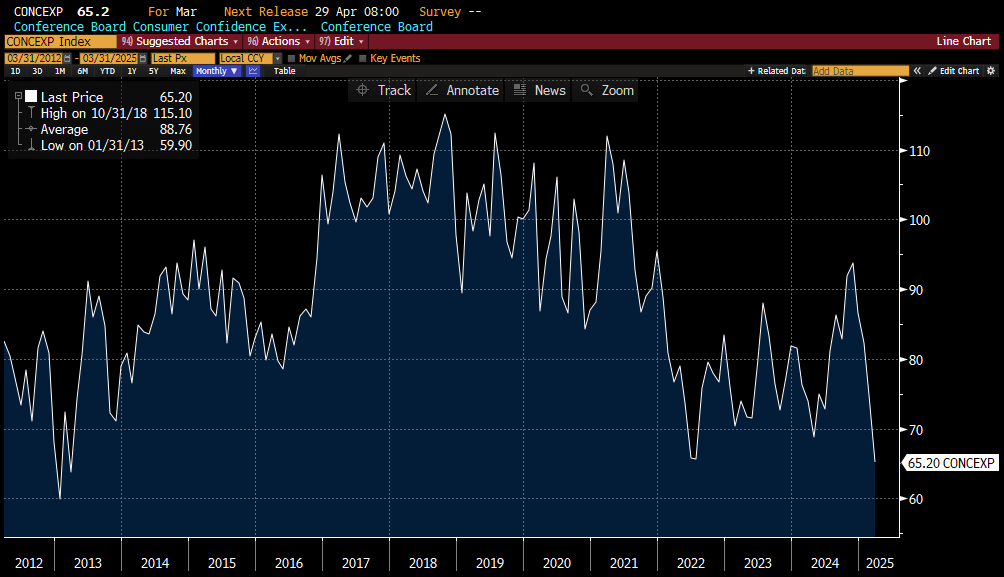
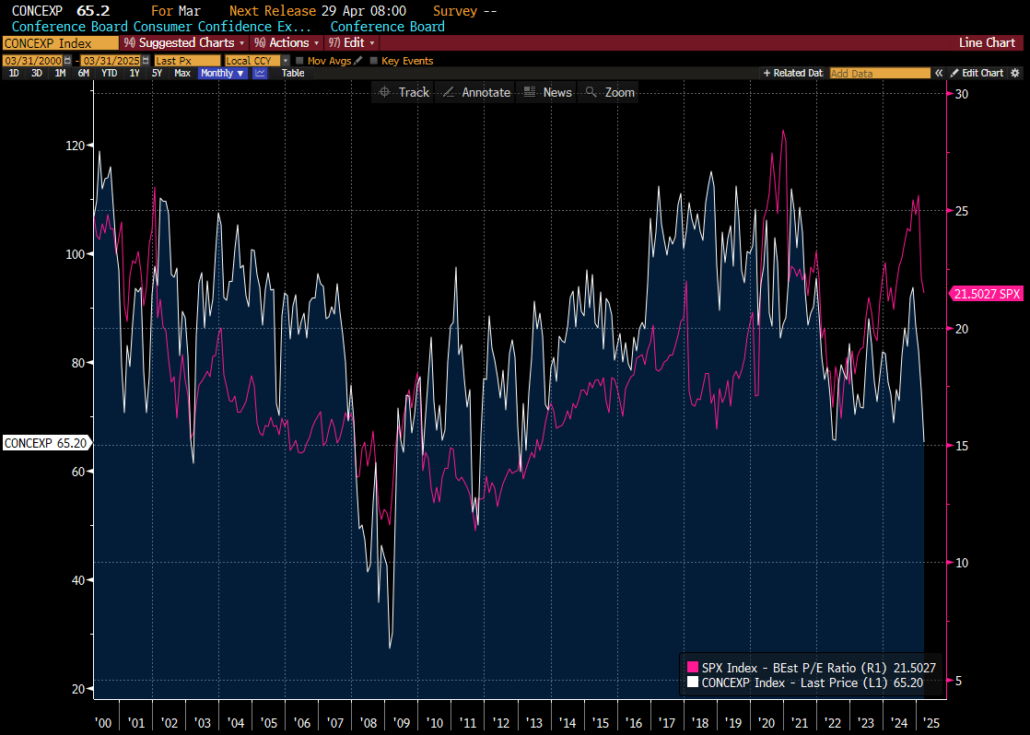
Both metrics above are considered “hard” data, it’s the “soft” data or survey-based metrics that have many wondering about the direction of the consumer.
Earlier in the week the Conference Board’s Consumer Confidence Expectations metric was released, and it was the lowest reading in over 10 years.
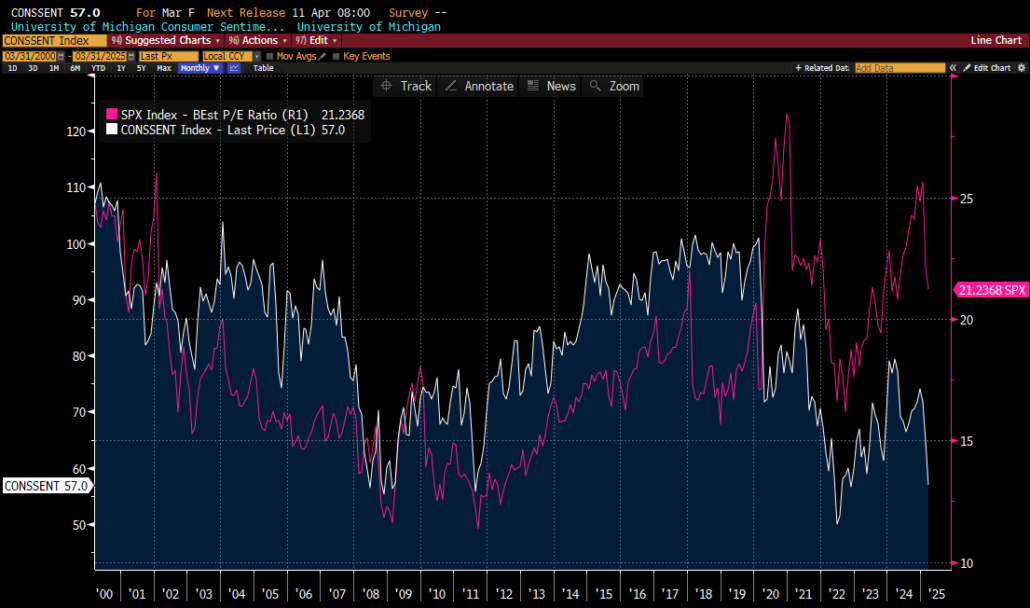
The problem with the above chart is its relationship to the Forward multiple on the SPX.
As shown above, when the survey approaches the 65 level or lower the multiple generally trends toward the 17X level, nowhere close to the present Fwd. multiple of 21.5X.
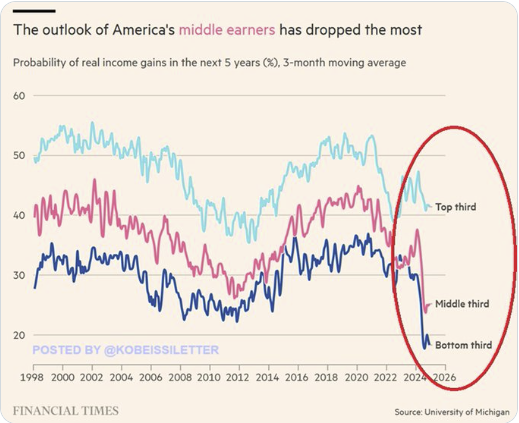
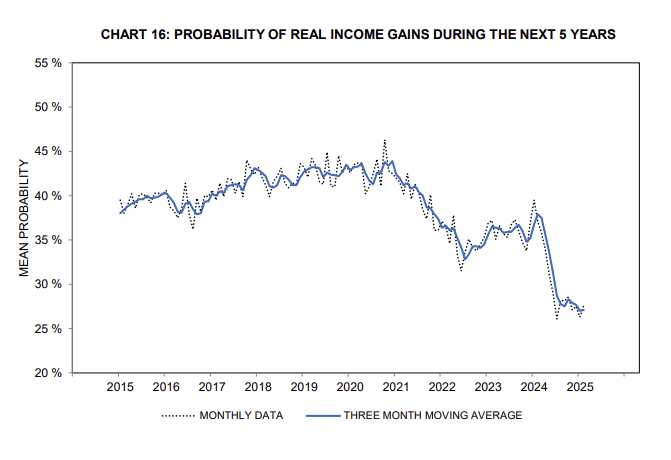
The University of Michigan has plenty of different surveys, one was released today, which we will discuss below, but first we wanted to point out their survey on the probability of real income gains in the next 5 years.
If the consumer does not expect to have increased future income, then why would they keep spending at current levels, let alone increase their spending?
Using the excel data available on the above link, we overlaid the above chart in Bloomberg. We added retail sales, in the middle panel, and the 4-week unemployment claims index, in the bottom panel.
Hard to believe sales don’t slow and that claims do not go higher?
As mentioned above, today the latest U of M Consumer Sentiment was released. It came in with one of the 5 lowest readings in the last 25 years. Like above, we have added the Fwd. SPX P/E multiple for perspective.
We think the above chart speaks for itself.
Why is it so hard to navigate?
We would like to offer an example we witnessed this week.
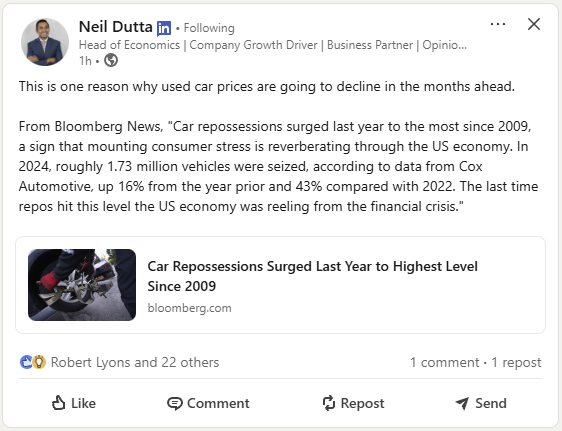
Used car pricing.
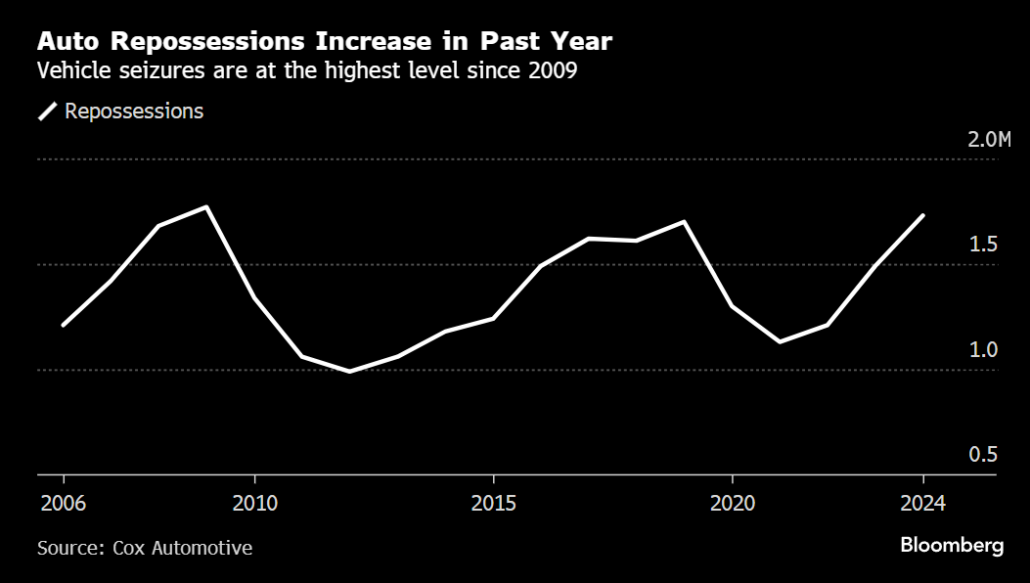
Bloomberg ran a story this past week on Wednesday, March 26th, pointing out that Auto repossessions have recently surged to their highest level since 2009.
“In 2024, roughly 1.73 million vehicles were seized, according to data from Cox Automotive, up 16% from the year prior and 43% compared with 2022. The last time repos hit this level the US economy was reeling from the financial crisis.
The figures are another indication that consumers are struggling to keep up with their monthly bills, thanks to both elevated interest rates and the lingering effects of higher car prices.”
One economist interpreted this as meaning used car prices will be declining soon. Seems logical to us.
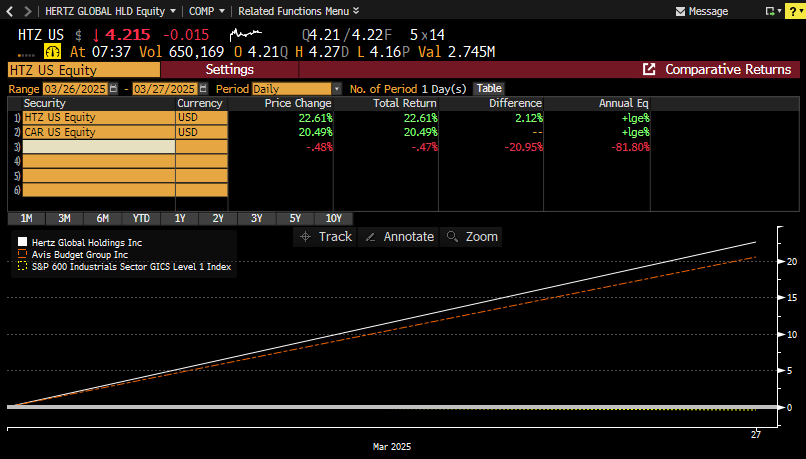
Fast forward to later that day after the close, Pres Trump announces part of his tariff plan, yes for the time being, and then the following day the auto companies all trade lower. Expected we would say.
What was not expected, at least as demonstrated by the stock reaction, was that companies with used car exposure would trade straight up. After all, we have reason to believe used car pricing is headed lower?
Two names up 20+% in 2 days, safe to say the market was caught off guard by the magnitude of the moves.
Our point is that it is becoming incredibly difficult to navigate these markets. What one can do is try to boil things down to a few simple factors or factor, and that brings us back to the consumer, who is after all the driving force behind 2/3rds of the economy.
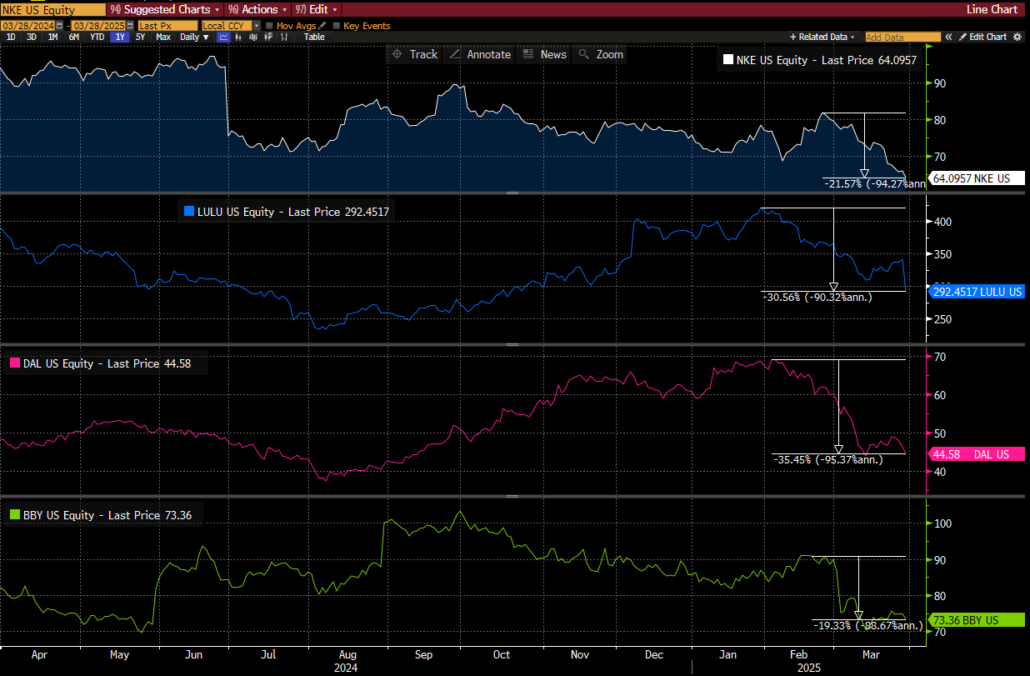
As discussed at the top, according to the Credit card companies and the hard data, the consumer is on solid footing. But many discretionary names, or more accurately their stock prices, are telling a different story.
Today, LULU was the latest casualty, but there are plenty of other examples away from the 4 names shown below, including but not limited to the cruise names, airlines, and hotel space.
Why point out the discretionary names specifically?
The final 2 charts of this discussion help tie up the point.
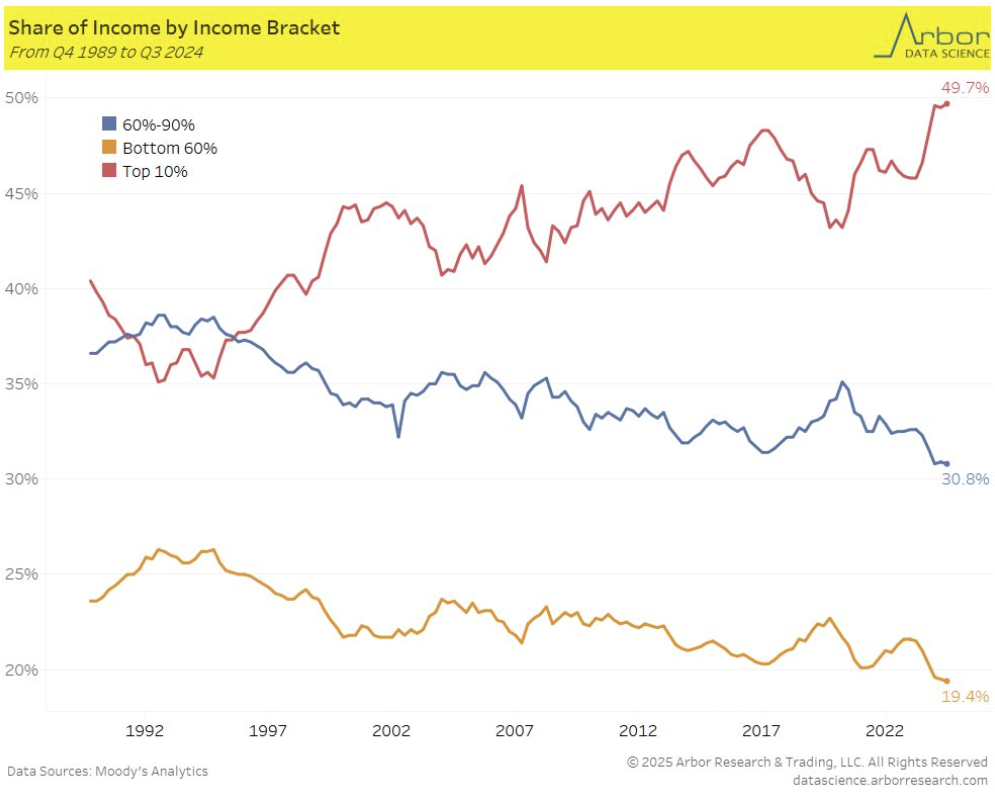
Utilizing data from Moody’s Analytics, Americans earning > $250,000 a year account for approximately 1/2 of all consumer spending in Q3 2024, up from 1/3 in 1990s. In other words, 10% of the population control 33% of the GDP, 66% of GDP is the consumer.
This same demographic is also overly represented in the equity market.
What happens to spending if the equity market takes a further hit?
Just to add one further twist, keeping with the confusion theme, this market is setting up for a rally due to counterintuitive reasons.
“Expectation for higher vs lower stock prices lowest since 2010. When people anticipate something they tend to prepare by acting accordingly, hence this is a contrarian indicator supported by our policy uncertainty and other sentiment surveys.”
it’s all very confusing.
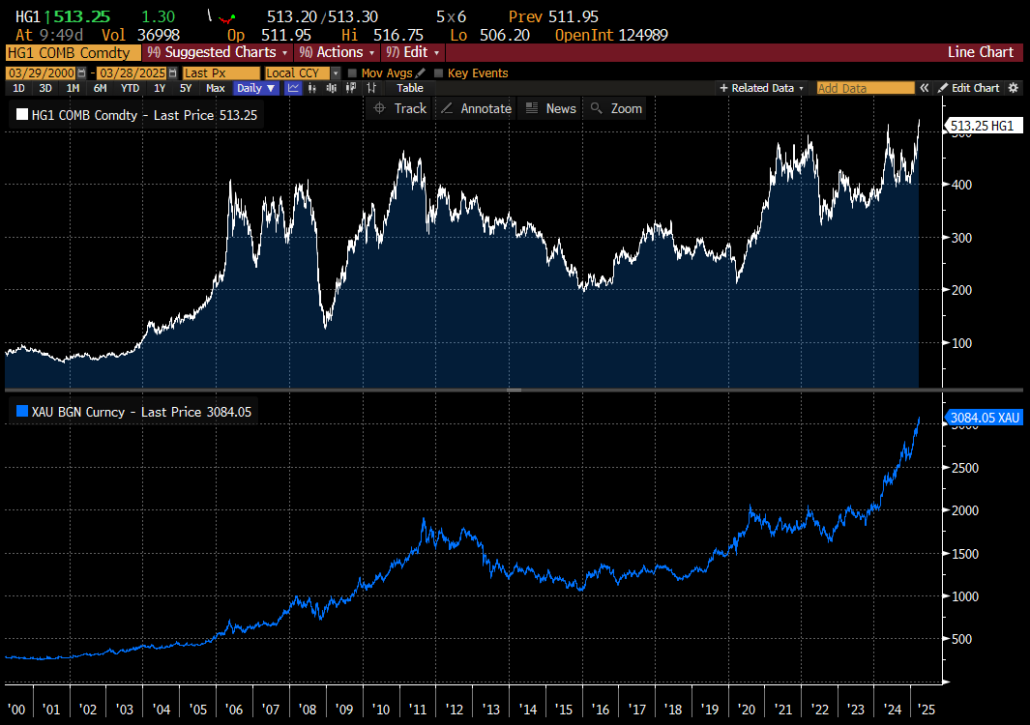
Commodities
The daily stuff appears to be headed in the right direction.
The ”dig it out of the ground” stuff is headed the other way. Copper in top panel, Gold in bottom. Both all time highs.
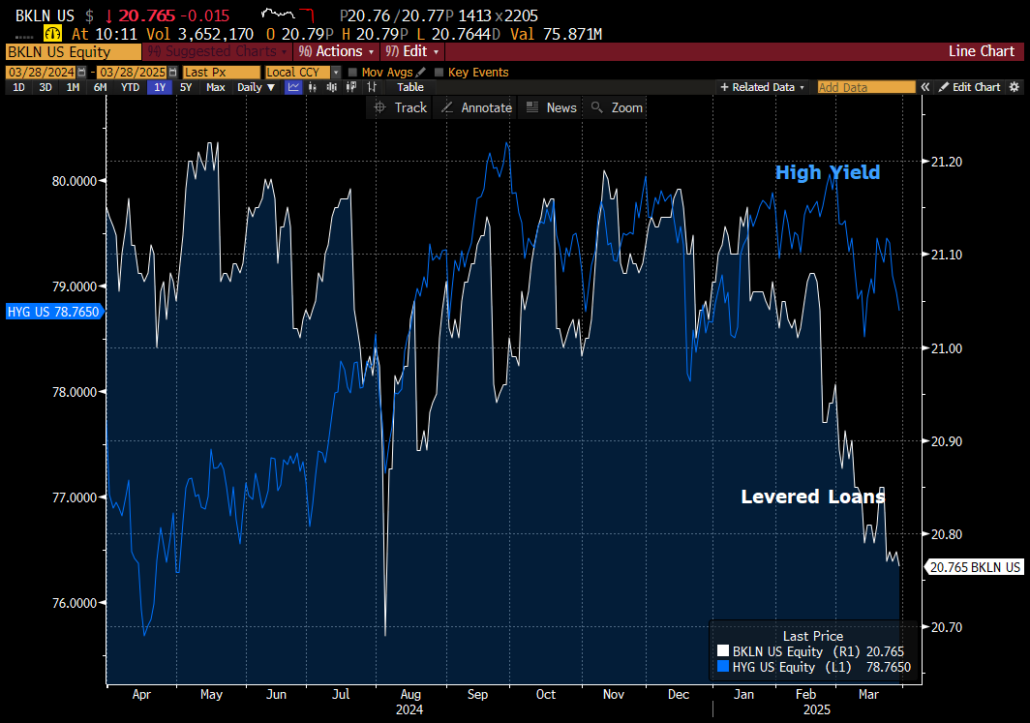
Levered loans vs High Yield
One quick chart that may concern some. Are levered loans leading high yield spreads? Is this a precursor to spreads widening?
Finally, we could not help ourselves….
Have a great weekend!
Best,
Meraki Trading Team
About Meraki Global Advisors
Meraki Global Advisors is a leading outsourced trading firm that eliminates investment managers’ implicit and explicit deadweight loss resulting from inefficient trading desk architectures. With locations in Park City, UT and Hong Kong, Meraki’s best-in-class traders provide conflict-free 24×6 global trading in every asset class, region, and country to hedge funds and asset managers of all sizes. Meraki Global Advisors LLC is a FINRA member and SEC Registered and Meraki Global Advisors (HK) Ltd is licensed and regulated by the Securities & Futures Commission of Hong Kong.
For more information, visit the Meraki Global Advisors website and LinkedIn page Contact: Mary McAvey VP of Business Development
https://merakiglobaladvisors.com/wp-content/uploads/2025/03/Meraki-Weekly-Trading-Digest-3.png10801920Meraki Global Advisorshttps://merakiglobaladvisors.com/wp-content/uploads/2021/03/meraki-logo-1.pngMeraki Global Advisors2025-03-28 23:51:042025-03-29 00:04:00Consumer/ Commodities/ Levered loans vs High Yield
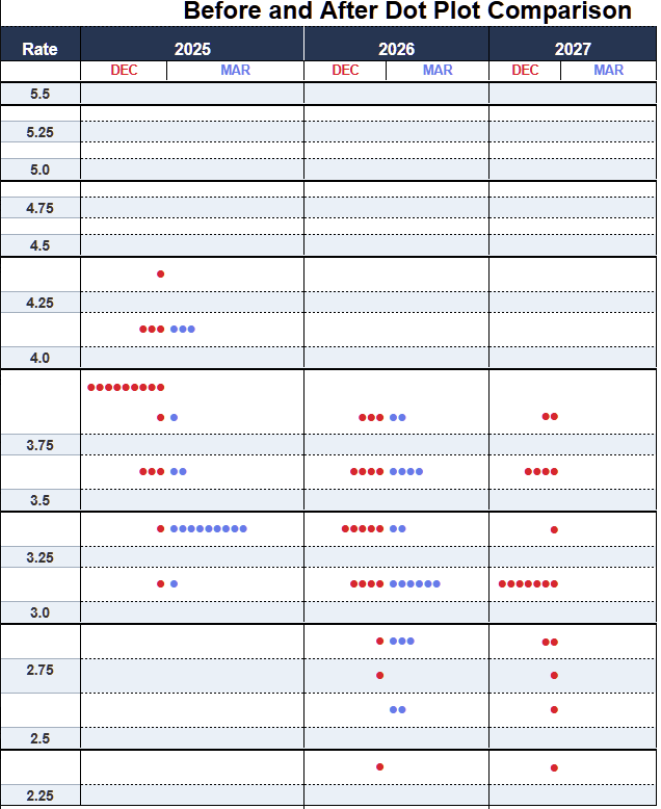
The Federal Reserve convened their scheduled March meeting this week. There were no expectations for any action to be taken, so the focus was largely on the commentary post the conclusion. We prefer to focus on one of the main outcomes, the DOT plot.
The cluster of red under 2025 at the 3.75 level moving lower to 3.25 and now blue appears to be the most significant move.
That move makes sense to us considering the Committee lowered their year end GDP forecast from 2.1% growth to 1.7%. As well as raise their year end unemployment forecast from 4.3% to 4.4%. But, the Committee also raised their year end PCE forecast from 2.5% to 2.8%.
So, slower growth but higher prices/inflation?
From the difference in direction 2 of the forecasts are headed above one could see how the Committee is concerned about risks to both of their mandates.
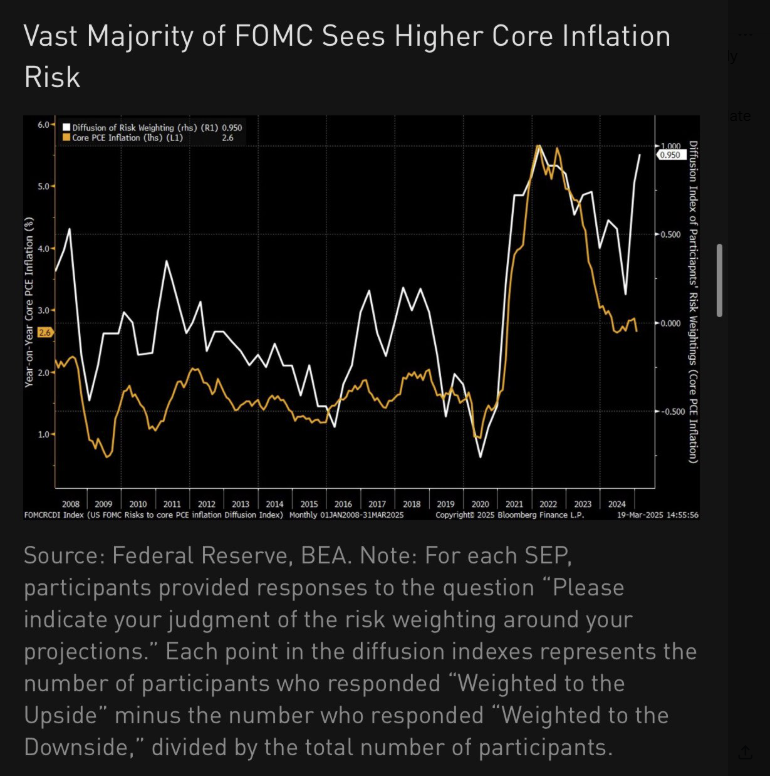
But are their concerns really 2 ways?
The SEP, or Summary of Economic Projections, completed quarterly, shows something a bit different. 18 of the 19 responses to the SEP see upside inflation risks. “The risk weighted core pce diffusion index (number of members see upside minus those who see downside, divided by total) is even more skewed toward upside than June 2022 (peak inflation).” Translation, the committee appeared to be more concerned with the threat of inflation than they were in 2022 when they hiked by 75bps.
These hard numbers do not seem to jive exactly with Chairmen Powell’s representation of the FOMC stance during the press conference. But the Chairman is politically savvy, and maybe, just maybe, presenting the FOMC stance in such a manner is to help prevent any White House irritability ahead of time?
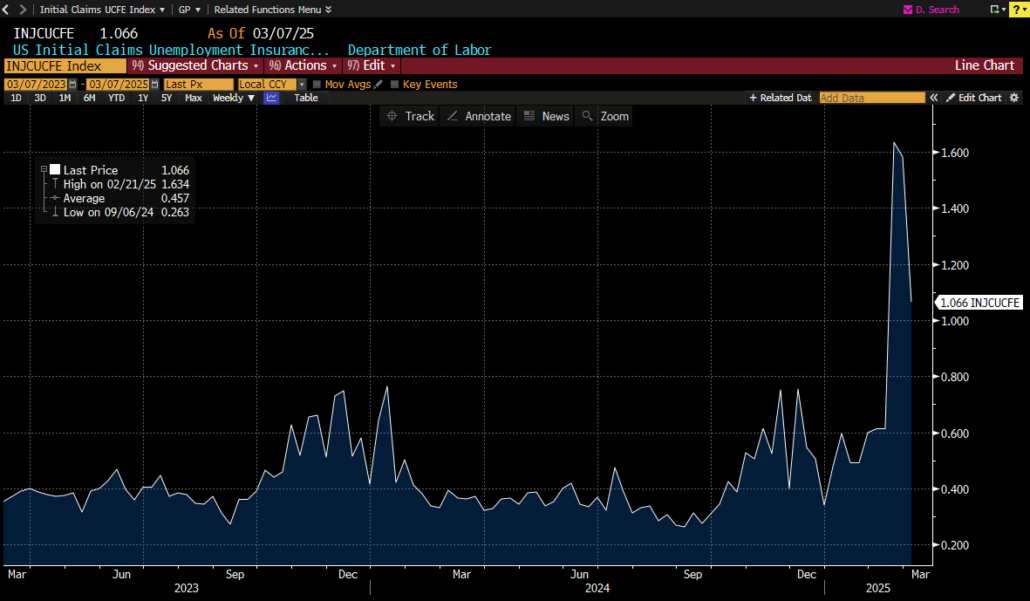
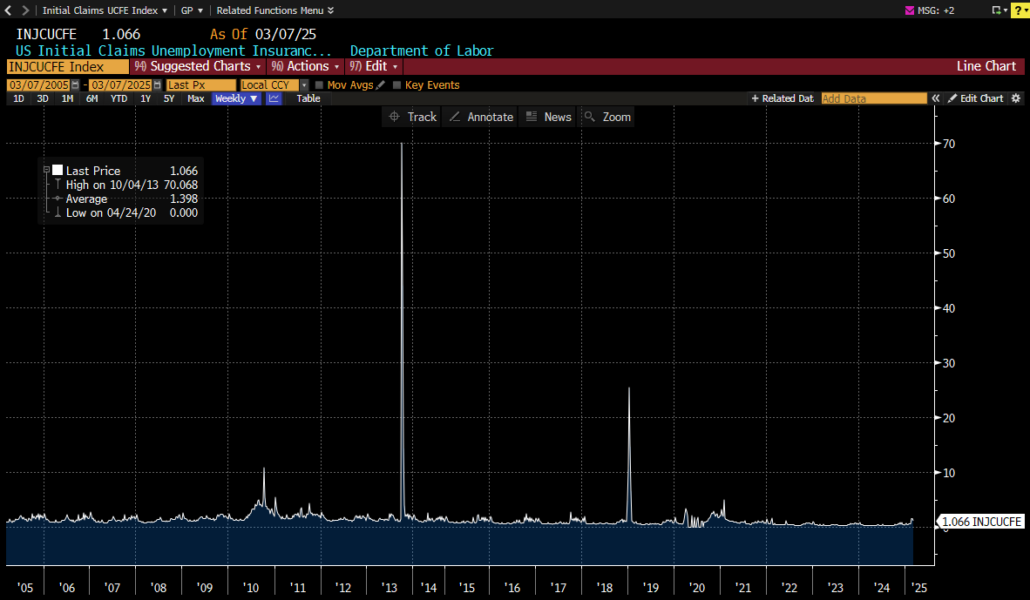
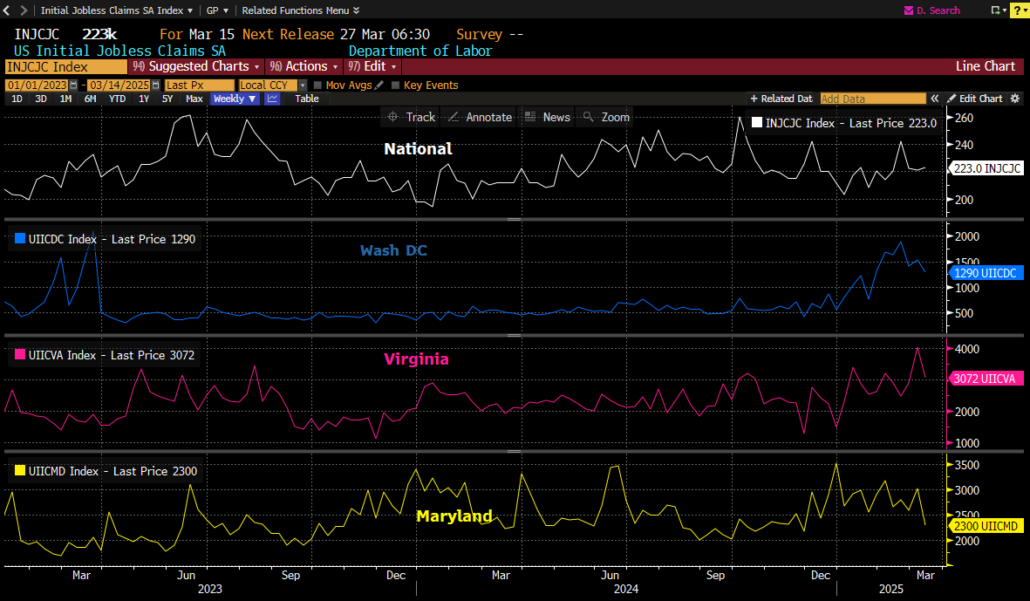
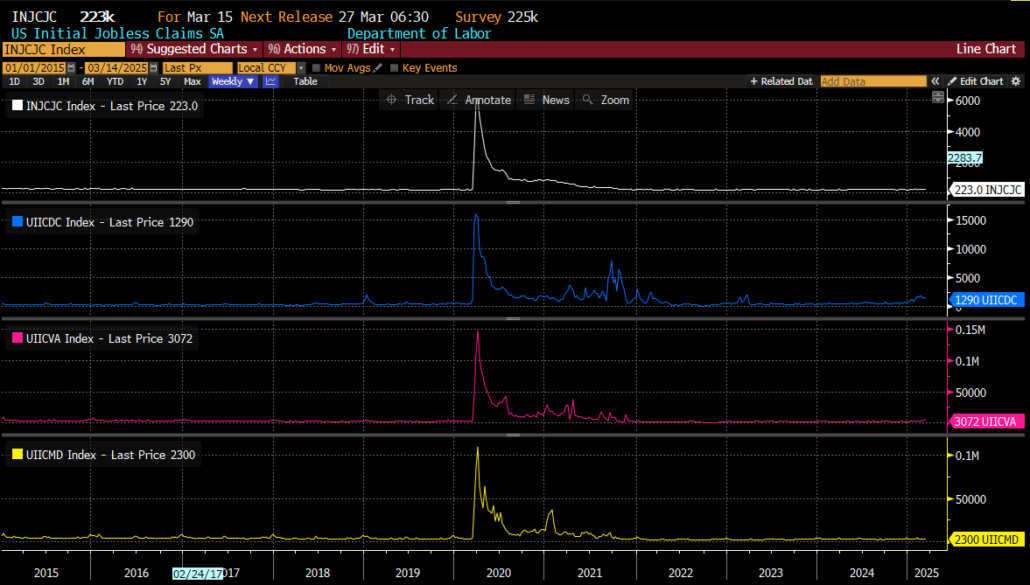
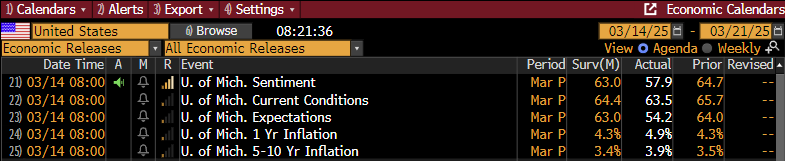
Unemployment
Oddly enough, the present stance of the FOMC might become justified if some of the existing concerns begin to come to fruition out there regarding unemployment levels rising. With much media focus on the new Department of Government Efficiency, many feel those levels rising are inevitable. As of now though, the numbers do not seem to bear that thesis out.
Government employee’s unemployment claims are classified separately from the individual state data.
Recently they did move meaningfully higher.
But in the grand scheme of things.
There could simply be procedural delays that are accounting for the lack of response, but as of right now it does not look concerning.
So, we thought we would look at the state numbers for non-government employee claims in the surrounding area of the capital.
There is some movement, but nothing jarring, yet.
Longer term view for perspective.
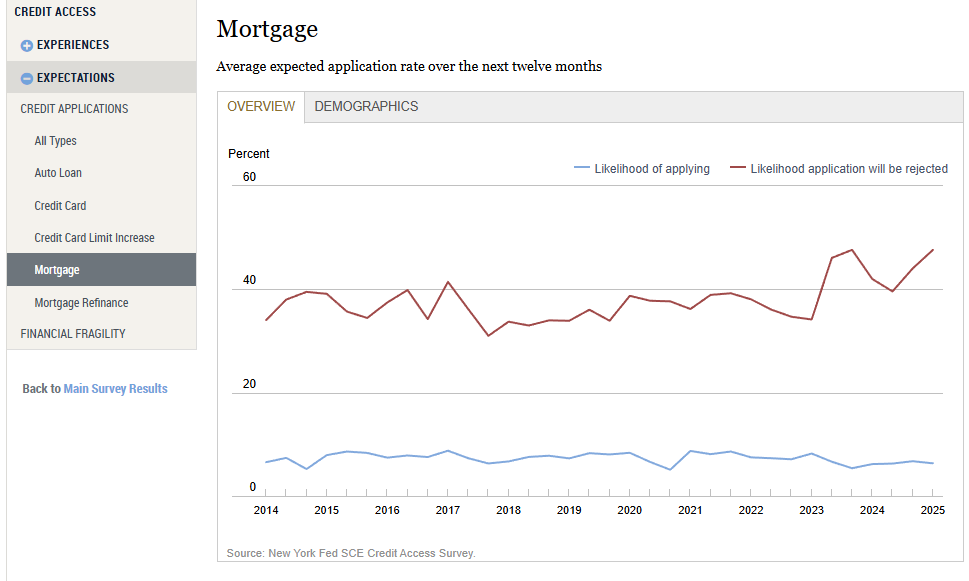
Delinquencies & Rejections
Somewhat of concern if those unemployment numbers do to begin to move higher is the state of the consumer. We have addressed debt levels and their associated costs to the consumer previously but wanted to look at the same issue from a different angle this week. The NY Fed website can offer a vast array of data surrounding the consumer, including rejection rates. Many of these charts are headed in the wrong direction.
As for delinquency data, missing auto payments are starting to be of concern.
Which brings us to the ultimate measure of consumer health, emergency savings. Although the present level should be considered healthy, the delta is headed in the wrong direction, and combined with any employment shock could spell trouble for the consumer’s health.
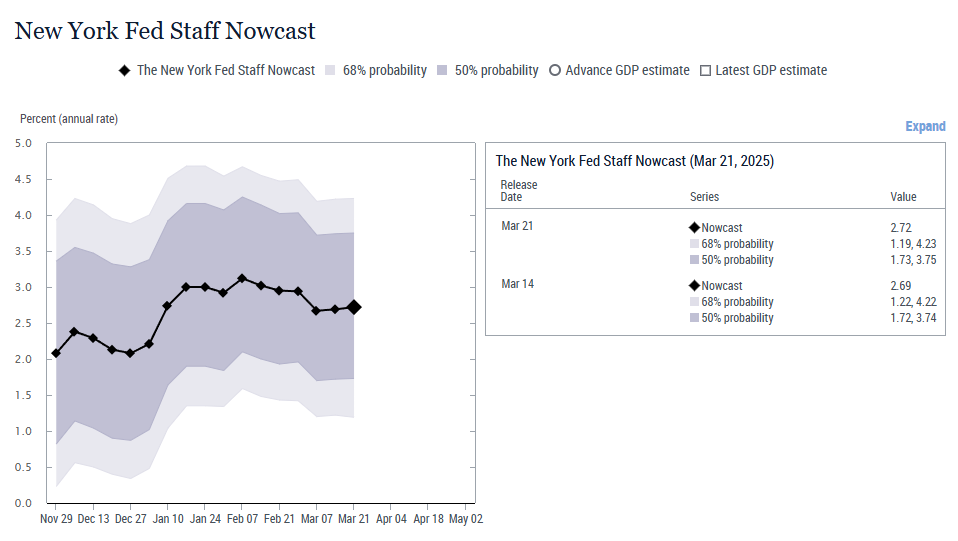
GDP Estimates
This is partially tongue in cheek, but one would think communication between Atlanta Fed peeps and NY Fed peeps should not be that hard. Granted we are familiar with the volatility of the Atlanta data, but still, they all work for the same department don’t they?
Atlanta is looking for -1.8% Q1 GDP presently. But NY on the other hand is looking for +2.72% Q1 GDP growth.
With a spread like this, we are surprised the likes of Fan Duel or Draft Kings is not getting in on the action.
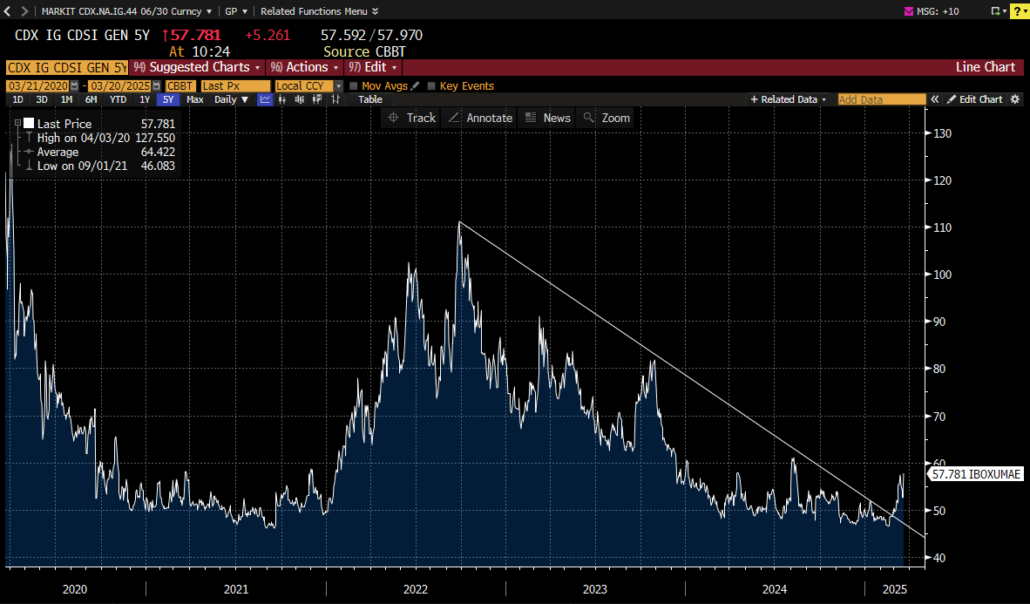
US CDS
Finally, we noticed a little pick up in the US Sovereign Credit Default Swap chart this week. Nothing to be concerned with, but we would like to point out that it looks to have broken its 3- year down trend.
Just sayin….
Earnings next week.
BYD Co Ltd (BYDDY) Mon, Mar 24
Cintas Corp (CTAS) Wed, Mar 26
Paychex (PAYX) Wed, Mar 26
Lululemon (LULU) Thu, Mar 27
Kuaishou (KSHTY) Tue, Mar 25
McCormick (MKC) Tue, Mar 25
H & M Hennes (HMB SS) Thu, Mar 27
Next Plc (NXT LN) Thu, Mar 27
Dollar Tree (DLTR) Wed, Mar 26
Chewy (CHWY) Wed, Mar 26
Porsche Auto (PAH3 GR) Wed, Mar 26
Jefferies (JEF) Wed, Mar 26
SailPoint (SAIL) Wed, Mar 26
TD SYNNEX (SNX) Thu, Mar 27
Crown Holding (CCK) Tue, Mar 25
GameStop (GME) Tue, Mar 25
Smithfield Food (SFD) Tue, Mar 25
Kingfisher Plc (KGF LN) Tue, Mar 25
KB Home (KBH) Mon, Mar 24
RH (RH) Thu, Mar 27
Wynn Macau (1128 HK) Thu, Mar 27
Oklo Inc (OKLO) Mon, Mar 24
HB Fuller (FUL) Wed, Mar 26
AAR Corp (AIR) Thu, Mar 27
Worthington (WOR) Tue, Mar 25
Verint System (VRNT) Wed, Mar 26
Steelcase Inc (SCS) Wed, Mar 26
Intuitive Mach (LUNR) Mon, Mar 24
Harrow Inc (HROW) Fri, Mar 28
Have a great weekend!
Best,
Meraki Trading Team
About Meraki Global Advisors
Meraki Global Advisors is a leading outsourced trading firm that eliminates investment managers’ implicit and explicit deadweight loss resulting from inefficient trading desk architectures. With locations in Park City, UT and Hong Kong, Meraki’s best-in-class traders provide conflict-free 24×6 global trading in every asset class, region, and country to hedge funds and asset managers of all sizes. Meraki Global Advisors LLC is a FINRA member and SEC Registered and Meraki Global Advisors (HK) Ltd is licensed and regulated by the Securities & Futures Commission of Hong Kong.
For more information, visit the Meraki Global Advisors website and LinkedIn page Contact: Mary McAvey VP of Business Development
https://merakiglobaladvisors.com/wp-content/uploads/2025/03/Meraki-Weekly-Trading-Digest-2.png10801920Meraki Global Advisorshttps://merakiglobaladvisors.com/wp-content/uploads/2021/03/meraki-logo-1.pngMeraki Global Advisors2025-03-21 23:28:552025-03-21 23:28:56FOMC Meet/ Unemployment/ Delinquencies & Rejections/ GDP Estimates/ US CDS
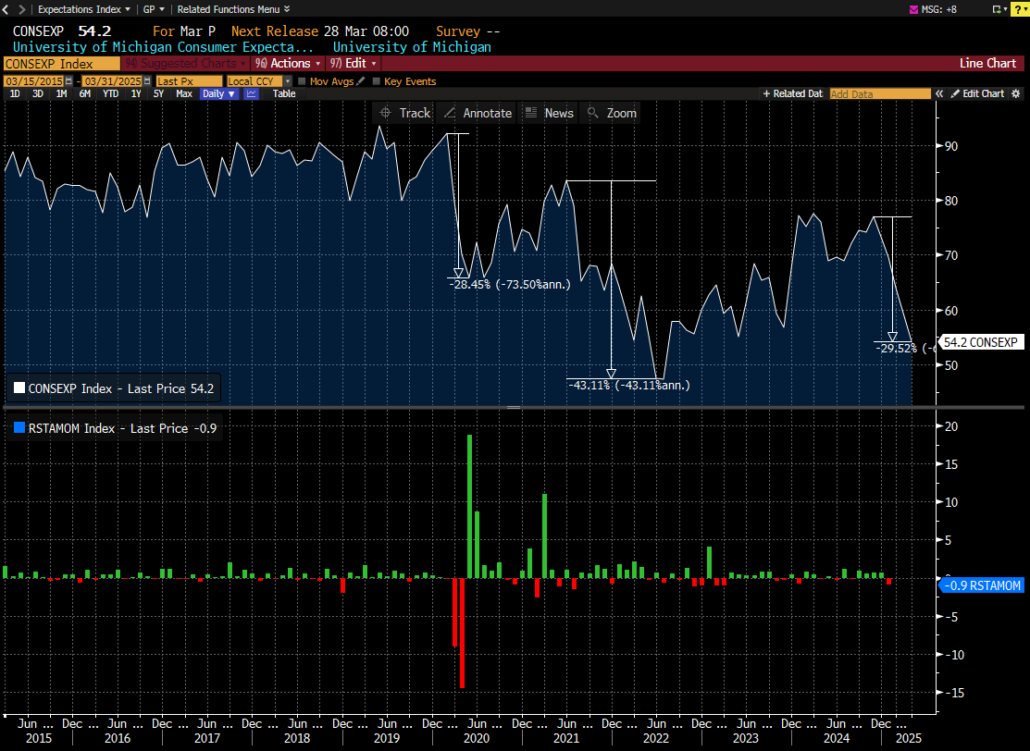
University of Michigan metrics were released today, and probably to nobody’s surprise they were weaker than estimates. At least 6 different consumer facing companies have mentioned they were seeing reduced consumer confidence recently, RH, DKS, DAL, UAL, KSS, and WMT.
“According to The Wall Street Journal, “Citi’s analysis of its U.S. credit-card data shows that spending has fallen across most retail categories. In the retail quarter to date, spending plunged 12% and 22% on apparel and athletic footwear, respectively, compared with a year earlier. But even less-discretionary categories such as food retail, aftermarket auto parts and pet retail are seeing moderate declines.”
The printed numbers showed sentiment is worse than previously thought and inflation expectations are also trending negatively. Not exactly the combination a healthy economy would like to see.
Taking a deeper look at the Expectations Index shows it is challenging the lows from the depths of the pandemic in mid-2022.
We add Adjusted Retail Sales Monthly % change as well to offer perspective of the impact to retail sales when this indicator moves meaningfully lower. As the chart depicts above, there appears to be a negative impact to sales post the significant pullbacks in the Michigan Sentiment, and it’s possible we have yet to experience that post this recent pullback.
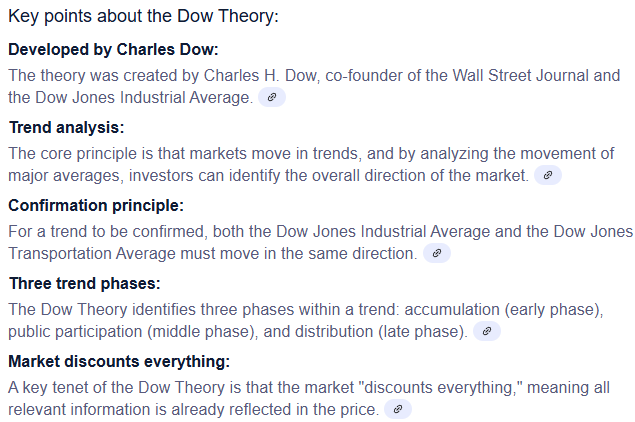
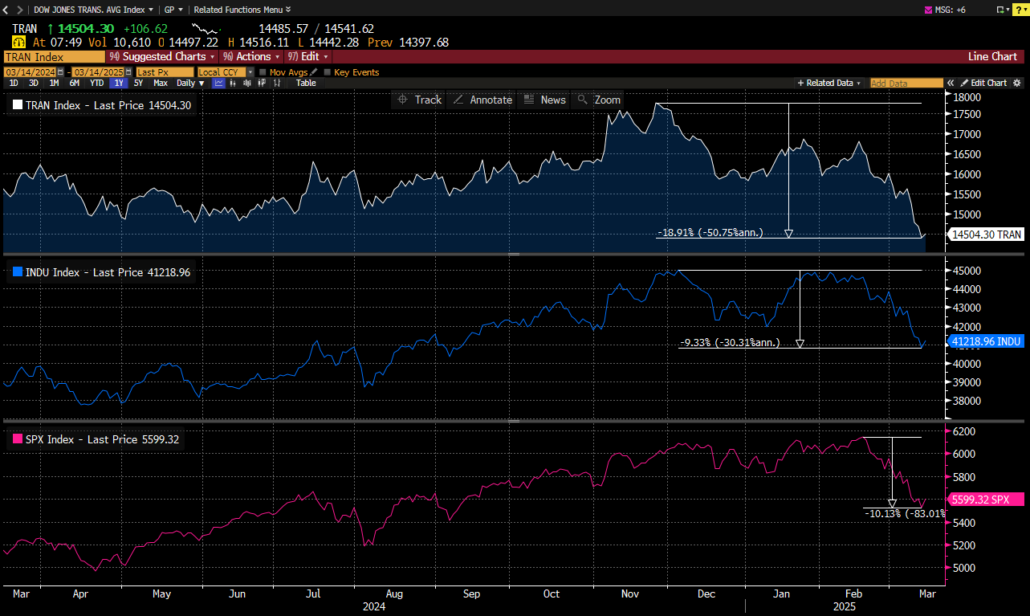
Dow Theory:
For all those unfamiliar with the Dow Theory we present the definition as presented by Google.
“The Dow Theory is a technical analysis concept that suggests stock markets move in trends, with primary, secondary, and minor fluctuations, and that these trends can be identified by analyzing the movement of major market averages like the Dow Jones Industrial Average and the Dow Jones Transportation Average, where both indices must confirm each other to signal a trend change; essentially, it states that a market trend is only valid if both averages move in the same direction.”
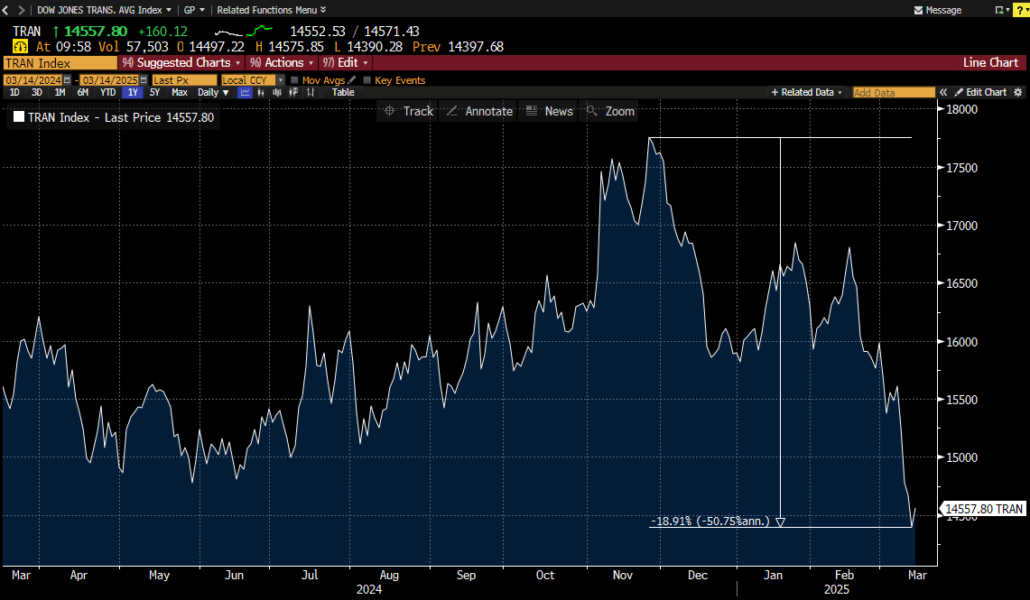
Why present this? Well it looks to us like the Transportation Index, TRAN Index, is breaking down. Despite today’s bounce, it is approaching the “Bear market threshold” of being down 20% from recent highs.
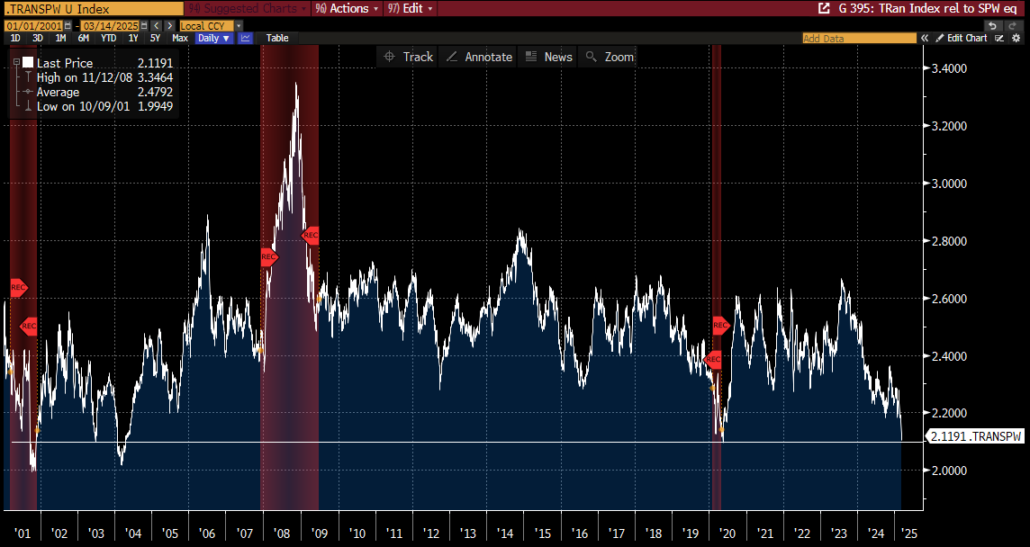
Looking at the same index relative to the equal weighted SPX, the SPW Index, it appears as if it is approaching a dangerous level. We choose the equal weighted index to try and minimize the magnificent 7 impact.
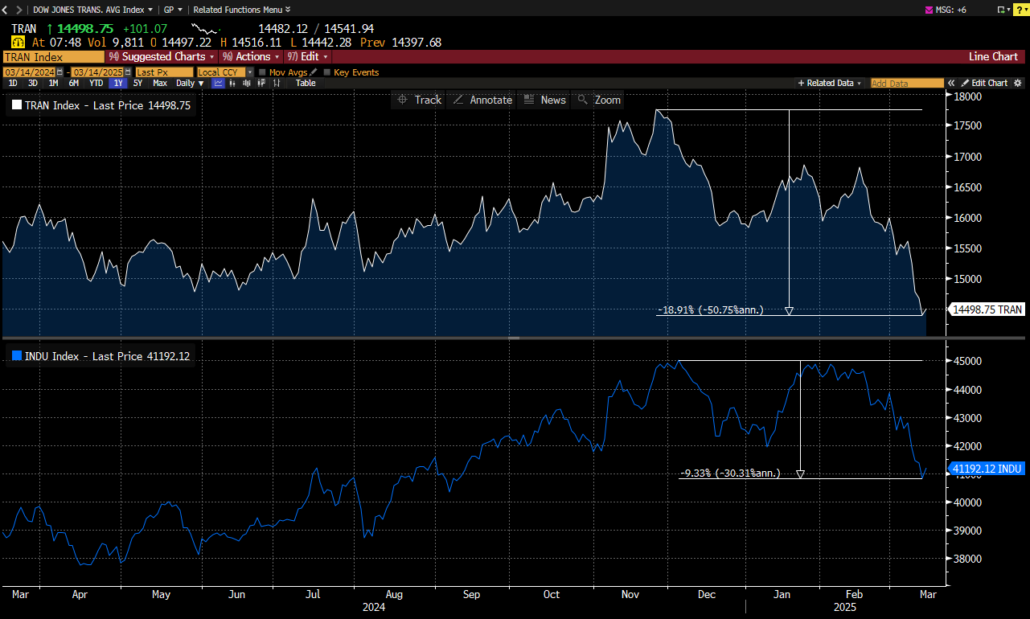
Back to the strict definition of the theory from above, the below chart shows that the DJ Industrial Index is following suit of the TRAN index.
Now adding the SPX Index, which is the more common barometer for the broader market, and it is also moving right in line with the Industrial Index.
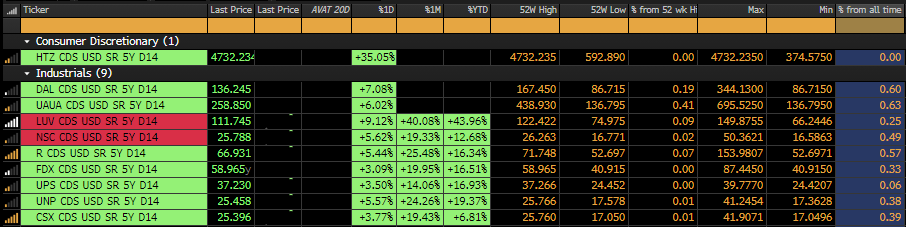
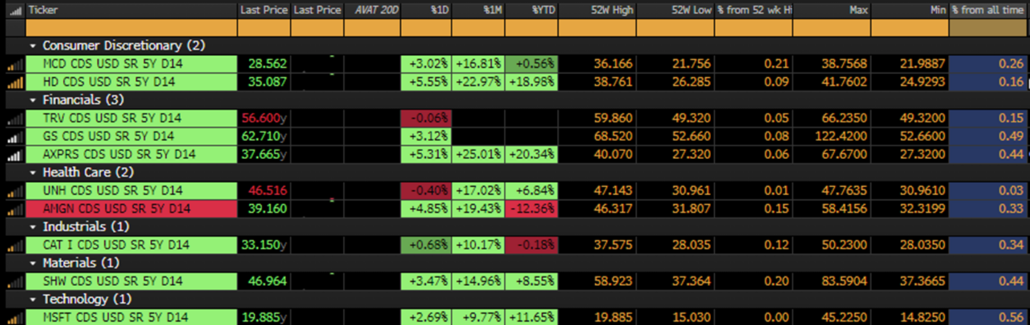
Now, there are some that could make the argument that the Transport Index does not carry the impact significance it has carried in past economic cycles. Not for us to opine on, but we would like to point something out that is similar to what we mentioned last week about corporate spreads starting to widen out a bit, but this time the focus is on CDS. We put together the largest members of each index that have similar Credit Default Swaps openly trading. Is it possible bond holders of some of the most prominent companies in the country are becoming cautious on their outlooks?
TRAN Index
INDU Index
The 4th column from the left in both matrixes show the % that the CDS is trading away from its 52-week high. The farthest left column offers the % from its all-time high. 8 of the 10 names in the TRAN Index CDS are trading within 10% of their 52-week highs, while 2 of the 10 are within 10% of their all time CDS highs.
With respect to the Dow Jones Industrial Index, 6 of the 10 names are trading within 10% of their 52-week highs, while only 1 name is within 10% of its all-time high.
So, what is the takeaway here, like the corporate spread point last week, the absolute levels are not threatening in the grand scheme of things, but the delta on the moves in CDS relative to their 52-week performance is notable, especially within the Transportation Index. From a very simplistic point of view, it is hard to see the economy improving if the companies that move goods are not fairing too well.
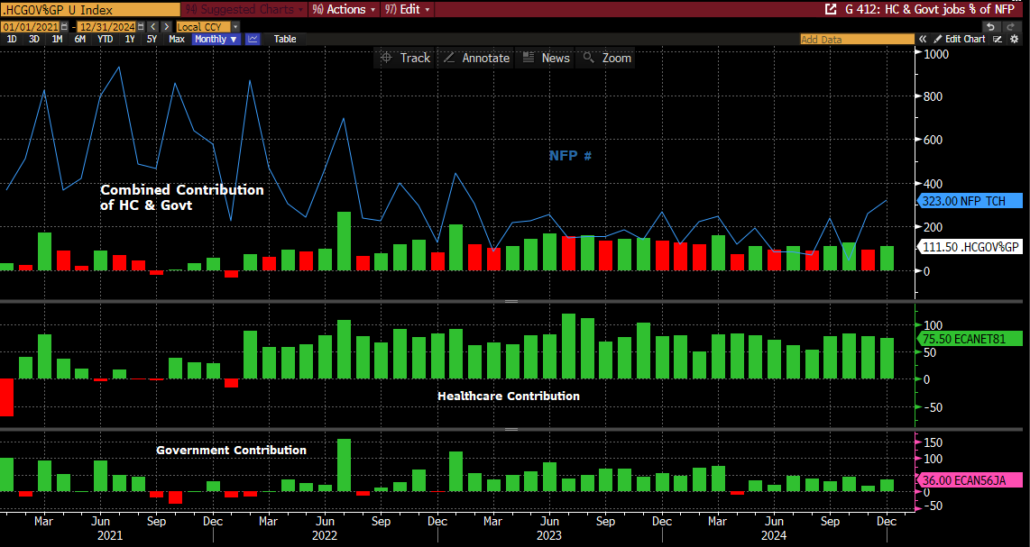
Revisiting Employment metrics:
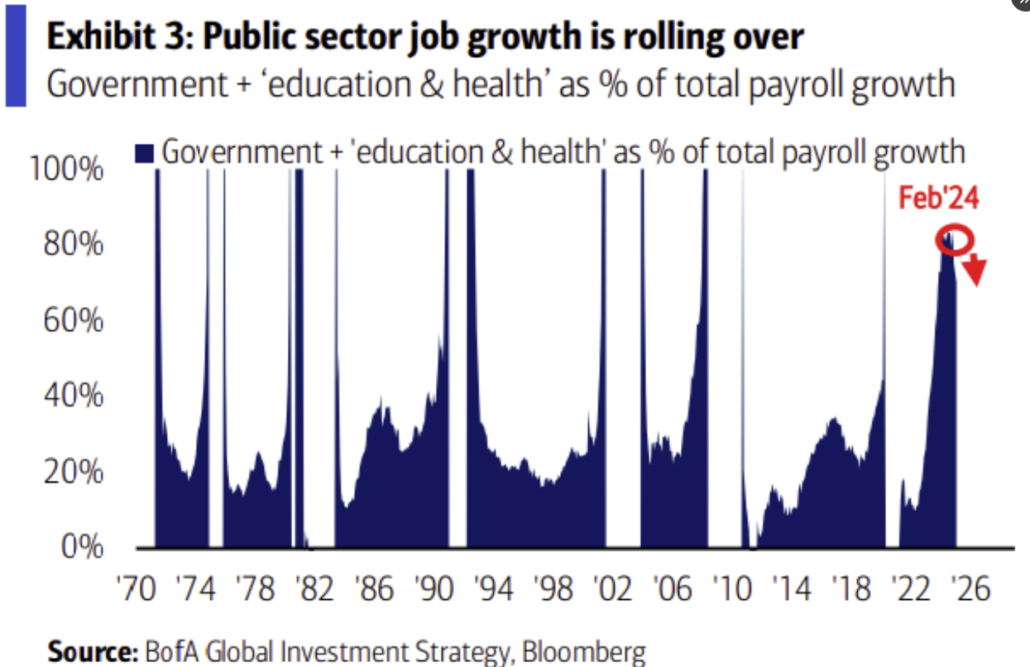
Bank of America published a chart this week we thought looked familiar.
It was published with this commentary:
“One year ago, 85% of US job market growth was in government and sectors dependent on government spending like health and education.”
“The global handoff from big government to the free market may prove slippery, but it seems necessary given large deficits and bloated debt burdens. Economic growth has been enabled by unsustainable government upport and protectionist policies.
It may take time for private sector job growth to accelerate, for government workers to resettle, for broad-based corporate profits to rise, and for global trade to find a new equilibrium. In our view, the likely productivity gains from a market-based economic reboot are greater than risks; and the risks from the unsustainable status quo of debt-financed, tepid, and narrow economic growth are severe.”
– Jared Woodard, BofA Global Research, March 12, 2025
We agree, and for those that might remember, we offered some charts a few weeks back suggesting the same point.
The above shows the % of Government job contribution as well as Healthcare and Education to the overall Non-Farm Payroll number. The simple point is if Government jobs will be trending lower as well as Health Care and Education, as a casualty of reduced Government spending, then the NFP may be in for some rough sailing going forward.
Next Week:
Next week eleven central banks have rate calls: FOMC, BoE, BoJ, Brazil, Swiss SNB, Sweden Riskbank, Iceland, Indonesia, South Africa, Taiwan and Chile
Other key events next week are:
Nvidia GTC; Jensen keynote Tues 3/18 at 1pm EST
China State Council briefing Monday re economic plans
US macro: ret sales, Empire Mfg, inds prodn, Philly Fed
US housing data: housing starts, existing homes, NAHB Housing
UST auction: $13b 20y and $18b 10y TIPS
EU data: Germany ZEW, Eurozone CPI, UK unemployment
China Macro: prop px, ret sales, inds prodn, prime rates
Japan: Aside from BoJ we have CPI, Inds Prodn
Oppie 35th Annual HCare conference
Piper 25th Energy Conference
RBC Opthalmology Conference
BofA Global Industrials Conference
Baidu to launch next gen of AI model, Ernie 4.5
Busiest week of EPS for China (sent separate email)
Meraki Global Advisors is a leading outsourced trading firm that eliminates investment managers’ implicit and explicit deadweight loss resulting from inefficient trading desk architectures. With locations in Park City, UT and Hong Kong, Meraki’s best-in-class traders provide conflict-free 24×6 global trading in every asset class, region, and country to hedge funds and asset managers of all sizes. Meraki Global Advisors LLC is a FINRA member and SEC Registered and Meraki Global Advisors (HK) Ltd is licensed and regulated by the Securities & Futures Commission of Hong Kong.
For more information, visit the Meraki Global Advisors website and LinkedIn page Contact: Mary McAvey VP of Business Development
https://merakiglobaladvisors.com/wp-content/uploads/2025/03/Meraki-Weekly-Trading-Digest-1.png21603840Meraki Global Advisorshttps://merakiglobaladvisors.com/wp-content/uploads/2021/03/meraki-logo-1.pngMeraki Global Advisors2025-03-14 23:22:312025-03-21 23:31:49Consumer Expectations/ Dow Theory/ Revisiting Employment metrics