Couple Charts to run through
Where to start after a week like that?
When market volatility explodes there is no shortage of content floating around. We thought going back to some simple basic charts for perspective might be helpful.
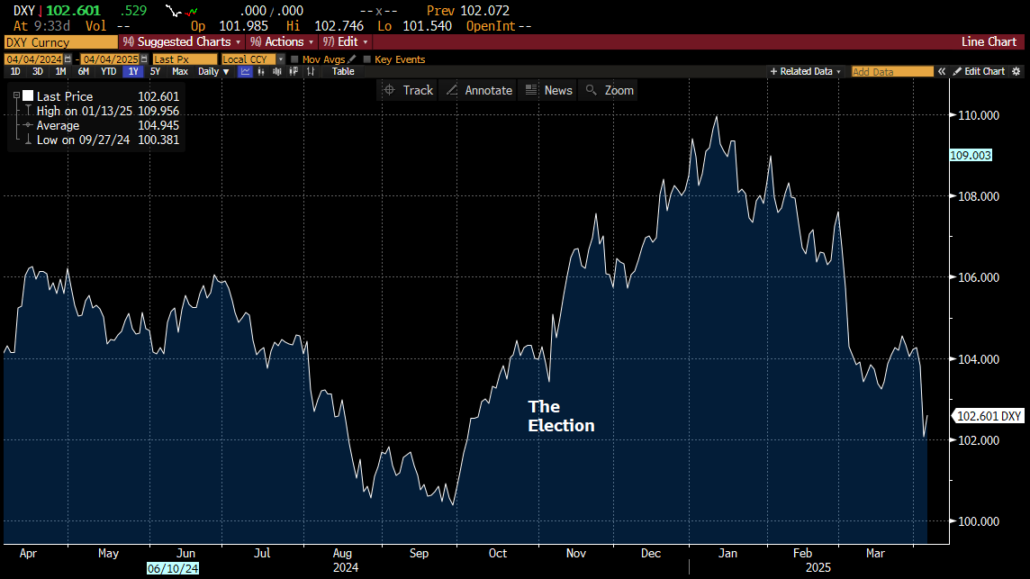
The $ has now round tripped its election move.
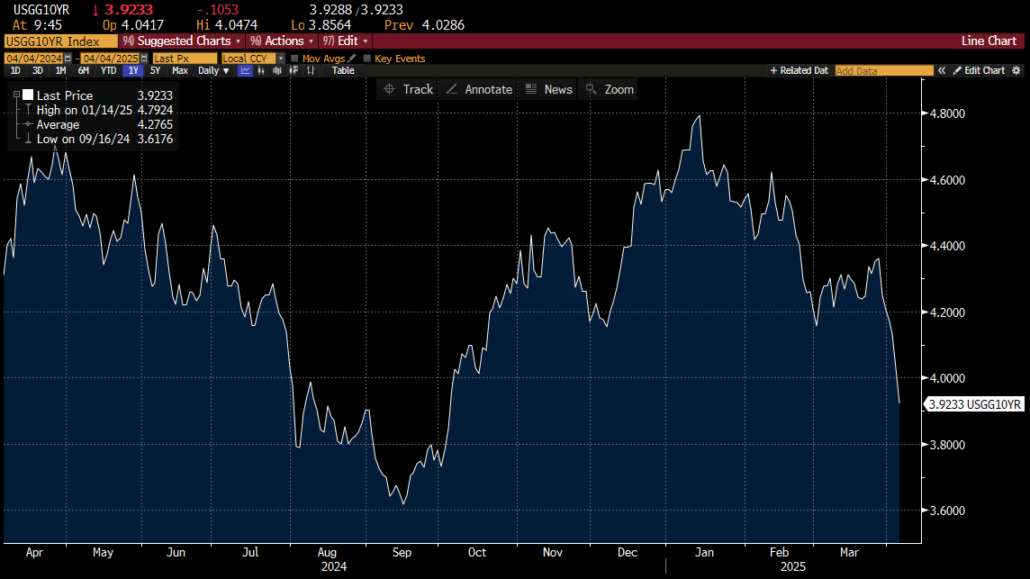
The 10yr TSY.
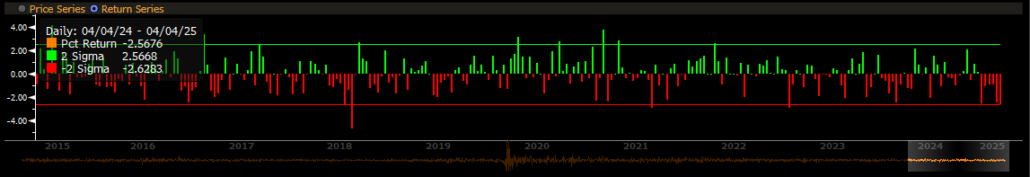
Adding HRH, Historical Return Histogram below as well, to show magnitude of recent moves.
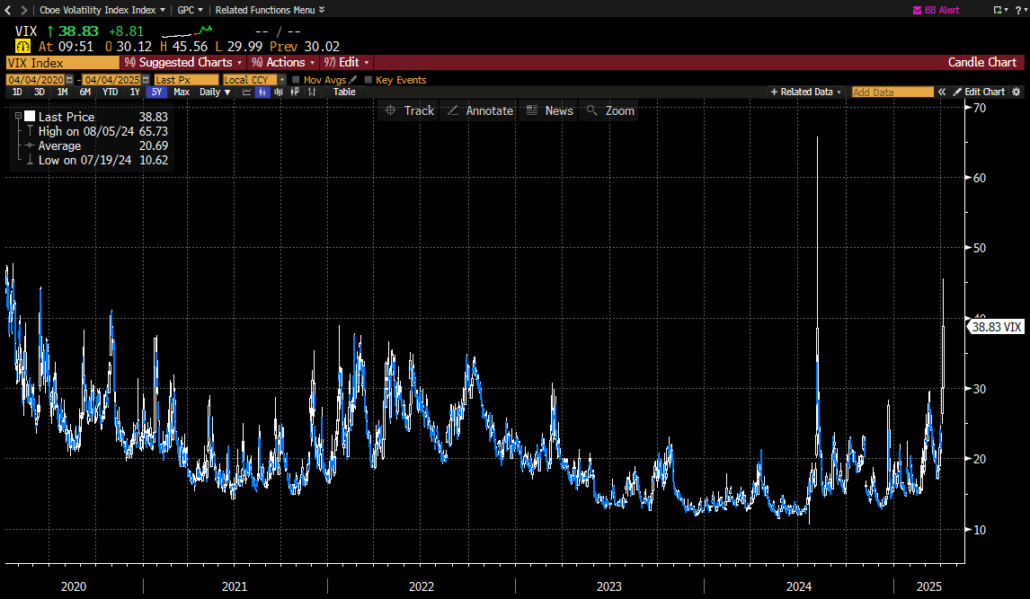
The VIX Index. With the introduction of ODTE options, some could argue the importance of this fear gauge has been slightly diminished, but we certainly think its still worth watching.
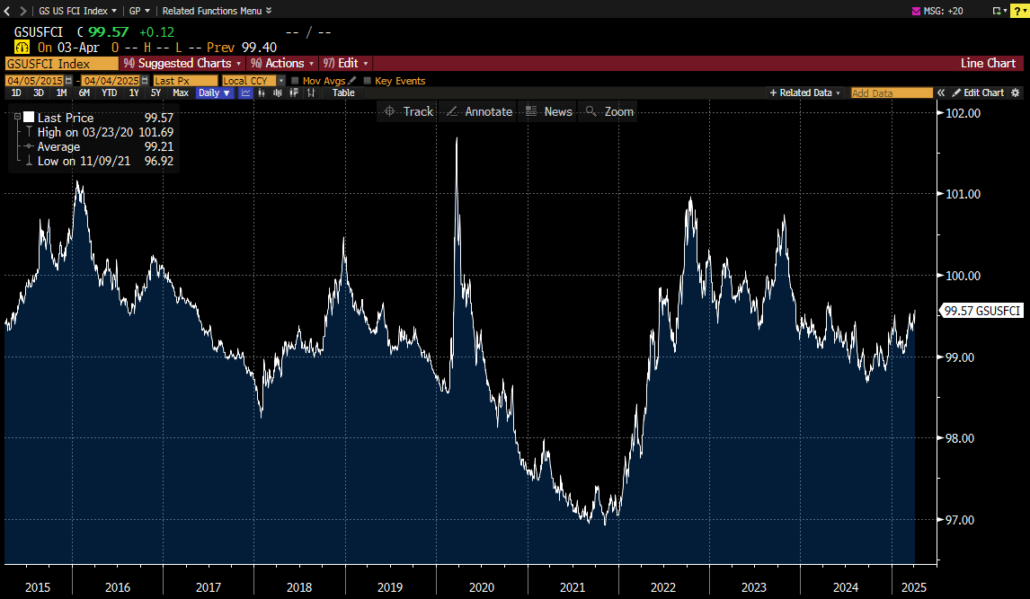
Goldman Sachs Financial Conditions Index. Unfortunately, there is still room for this Index to move higher, and thus financial conditions could certainly still get tighter from here.
High Yield & CDS
Bloomberg US Corporate High Yield Average OAS
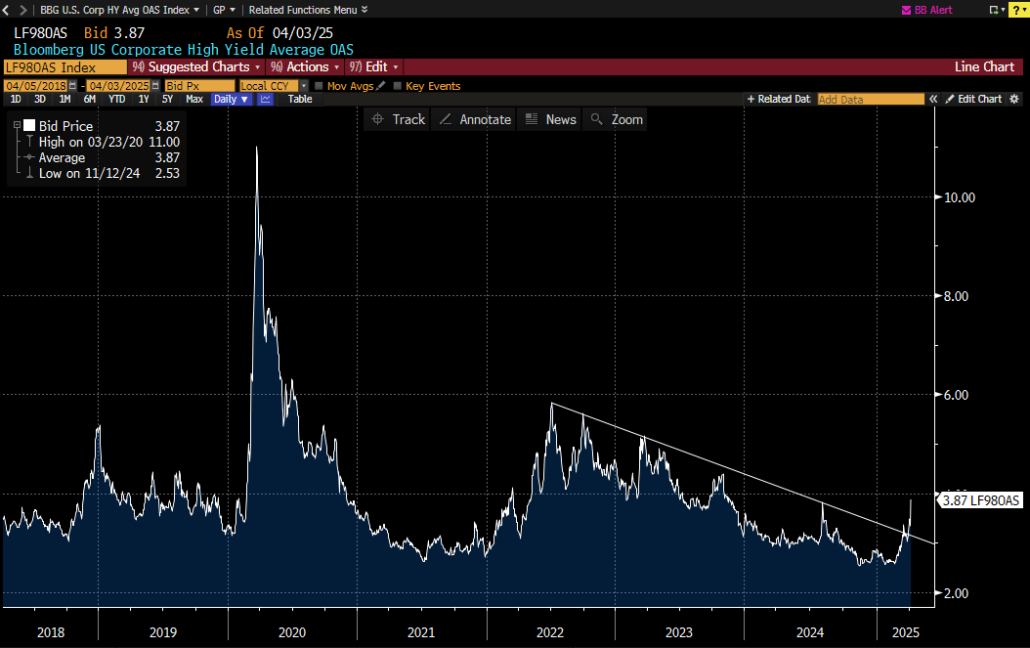
Surpassing August 2024 highs.
CDX HY CDSI GEN 5Y SPR:
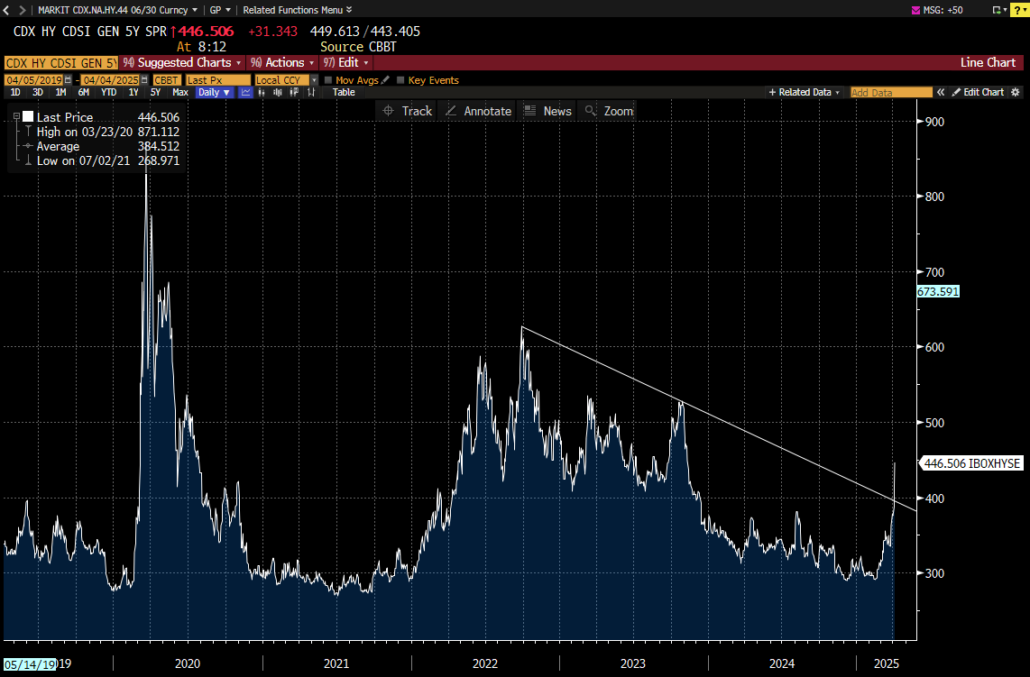
As shown above both indices appear to be breaking from a down trend.
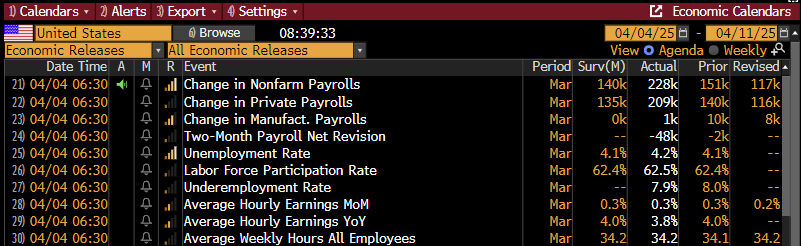
Hard to believe that Nonfarm Payroll release would take a back seat to any market impactful news, but today it most certainly did. Along with the Nonfarm payroll release come Hourly earnings metrics.
We wanted to look into the relationship between the Average Hourly earnings YoY and the Federal Reserve’s choice inflationary measure, Core PCE YoY.
Respective charts:
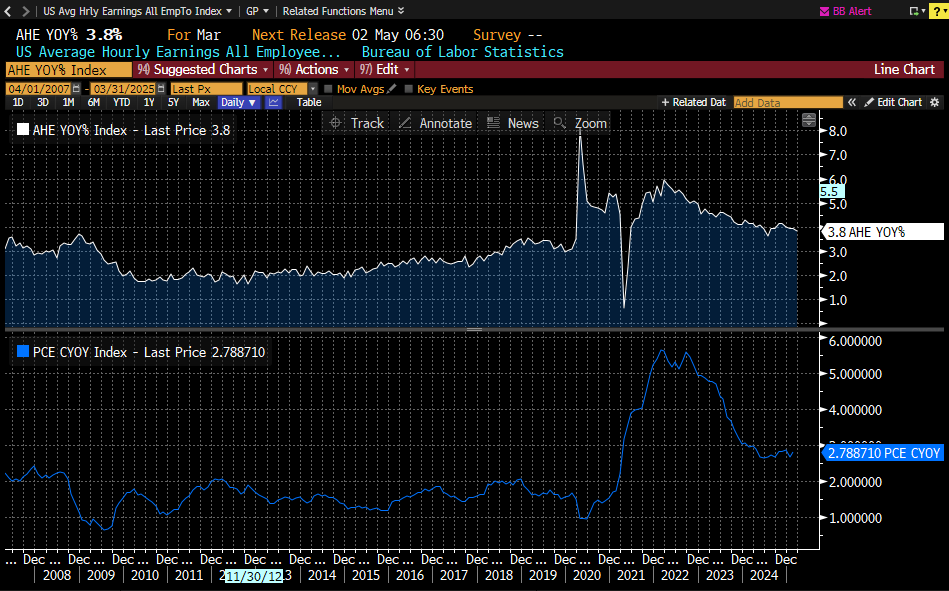
If we make the above 2 metrics a ratio, AHE YoY – PCE CYoY, we will generate the below chart in the top panel.
If the declining trend in average hourly wage growth continues the white line will continue moving lower. A concern is that the Core PCE is expected to move higher at the same time, most likely driving the white line down to or below 0. As shown above, when this ratio dips below that level, the Forward multiple on the SPX settles in somewhere between 12 and 17X usually. Still a long way from the most recent level of close to 21X.
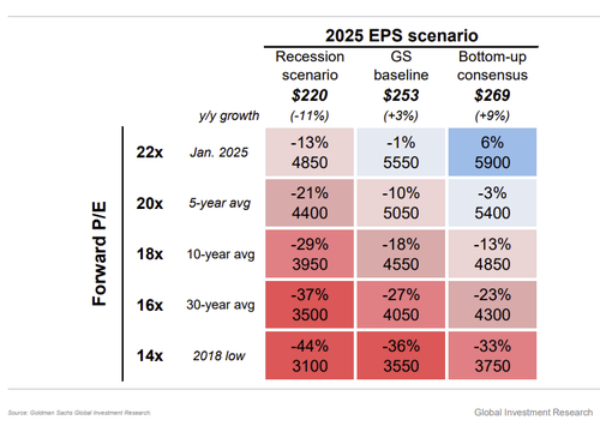
Goldman Sachs addresses the impact of lower multiples as well in their scenario metric below.
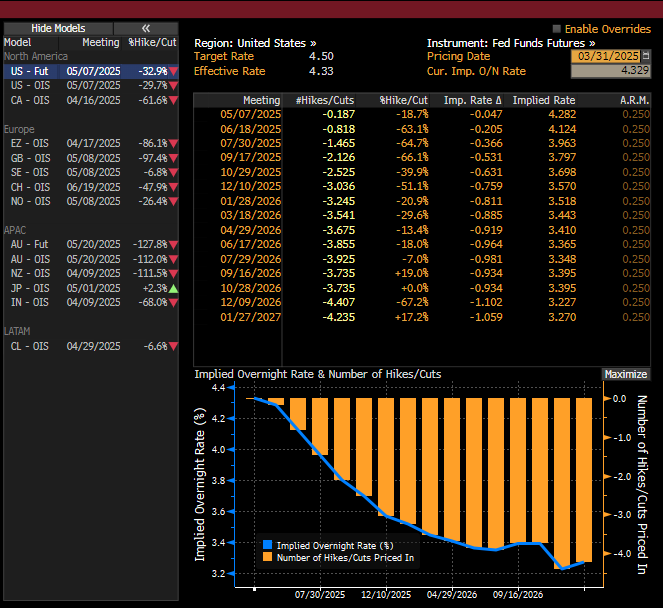
This week’s impact on the Fed futures market.
Looking at the 12/10/2025 meeting below, it suggests 3 cuts as of Monday, March 31st.
Fast forward to today, Friday, April 4th that number moves to 4+ cuts now.
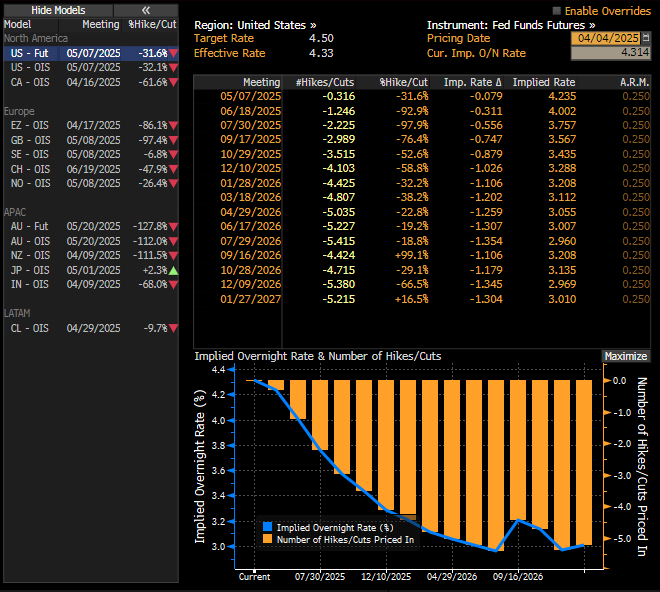
Chairmen Powell just finished speaking at a schedule engagement a little while ago. His message was simple: the Fed is in a great spot to sit back and see what happens with the tariff impact AND THEN determine what action to take.
Well, as shown by the WIRP page above, the market is starting to think differently.
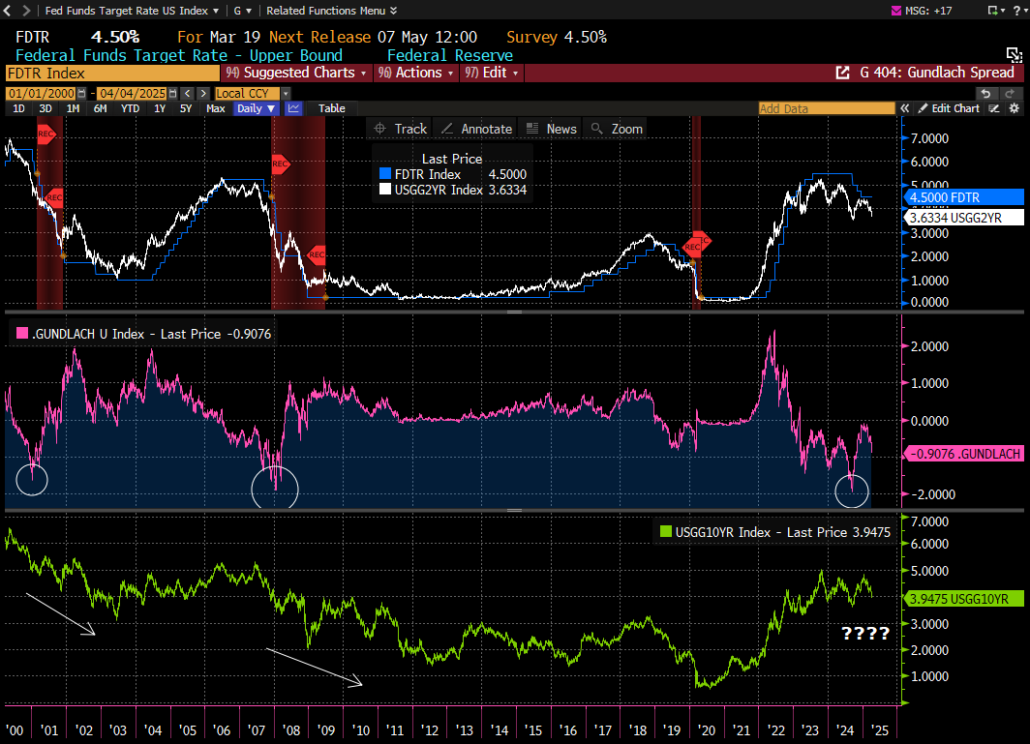
There has always been a belief that the Fed follows the direction of the 2yr TSY, if it moves to far away from the Fed Funds rate, eventually the Fed must simply catch up.
Well, below we chart this thesis. The top panel has both the 2yr TSY and the Fed Funds rate. The middle panel contains the spread of those 2 constituents. The bottom panel contains the 10yr TSY.
If the 2yr TSY continues to move lower, it would seem reasonable to assume the Fed will have to follow.
Have a great weekend!
Best,
Meraki Trading Team
About Meraki Global Advisors
Meraki Global Advisors is a leading outsourced trading firm that eliminates investment managers’ implicit and explicit deadweight loss resulting from inefficient trading desk architectures. With locations in Park City, UT and Hong Kong, Meraki’s best-in-class traders provide conflict-free 24×6 global trading in every asset class, region, and country to hedge funds and asset managers of all sizes. Meraki Global Advisors LLC is a FINRA member and SEC Registered and Meraki Global Advisors (HK) Ltd is licensed and regulated by the Securities & Futures Commission of Hong Kong.
For more information, visit the Meraki Global Advisors website and LinkedIn page
Contact:
Mary McAvey
VP of Business Development


")

