Consumer Expectations/ Dow Theory/ Revisiting Employment metrics
Consumer Expectations:
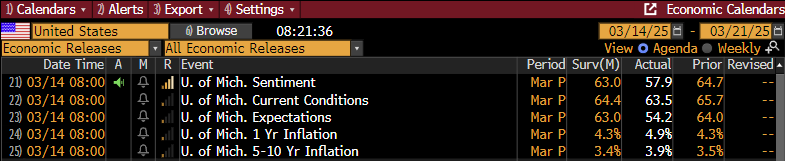
University of Michigan metrics were released today, and probably to nobody’s surprise they were weaker than estimates. At least 6 different consumer facing companies have mentioned they were seeing reduced consumer confidence recently, RH, DKS, DAL, UAL, KSS, and WMT.
“According to The Wall Street Journal, “Citi’s analysis of its U.S. credit-card data shows that spending has fallen across most retail categories. In the retail quarter to date, spending plunged 12% and 22% on apparel and athletic footwear, respectively, compared with a year earlier. But even less-discretionary categories such as food retail, aftermarket auto parts and pet retail are seeing moderate declines.”
Caution Clouds Walmart and Amazon Outlook as Shoppers Tighten Budgets
The printed numbers showed sentiment is worse than previously thought and inflation expectations are also trending negatively. Not exactly the combination a healthy economy would like to see.
Taking a deeper look at the Expectations Index shows it is challenging the lows from the depths of the pandemic in mid-2022.
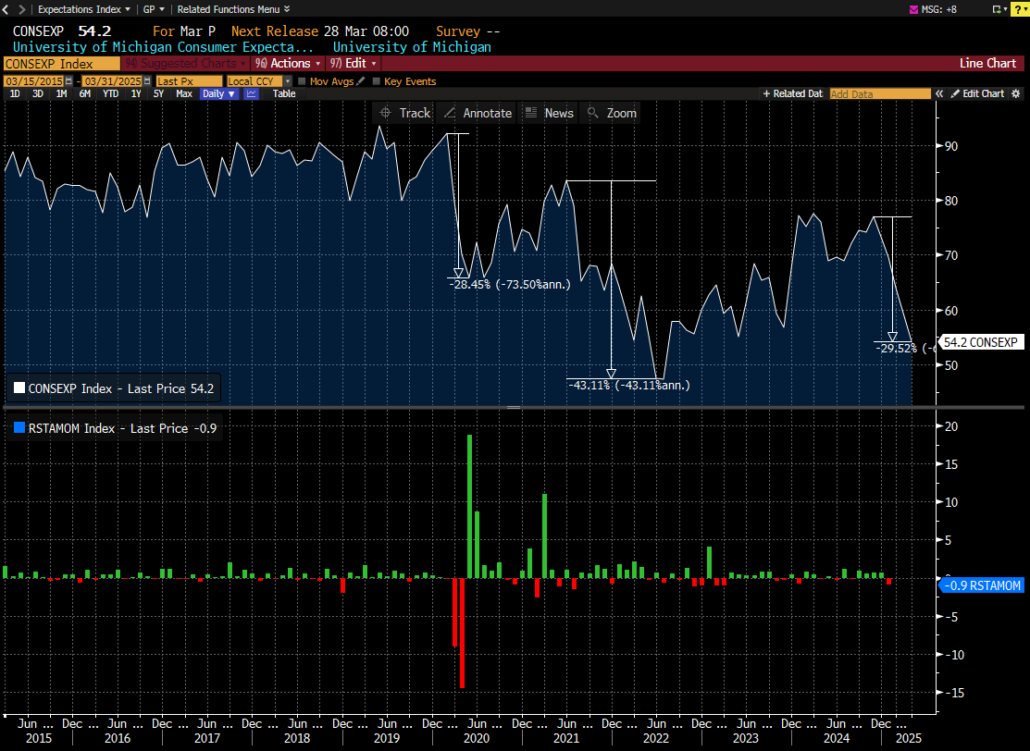
We add Adjusted Retail Sales Monthly % change as well to offer perspective of the impact to retail sales when this indicator moves meaningfully lower. As the chart depicts above, there appears to be a negative impact to sales post the significant pullbacks in the Michigan Sentiment, and it’s possible we have yet to experience that post this recent pullback.
Dow Theory:
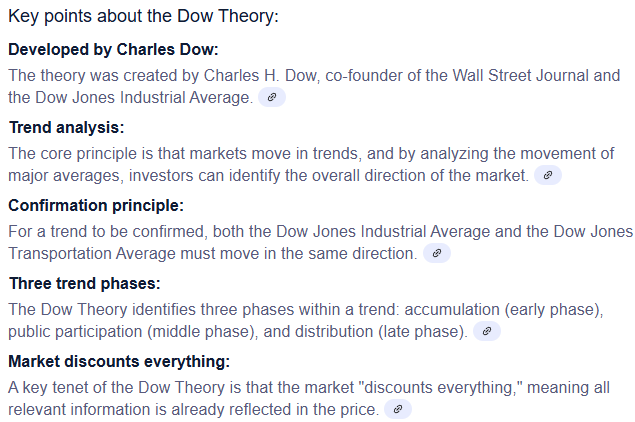
For all those unfamiliar with the Dow Theory we present the definition as presented by Google.
“The Dow Theory is a technical analysis concept that suggests stock markets move in trends, with primary, secondary, and minor fluctuations, and that these trends can be identified by analyzing the movement of major market averages like the Dow Jones Industrial Average and the Dow Jones Transportation Average, where both indices must confirm each other to signal a trend change; essentially, it states that a market trend is only valid if both averages move in the same direction.”
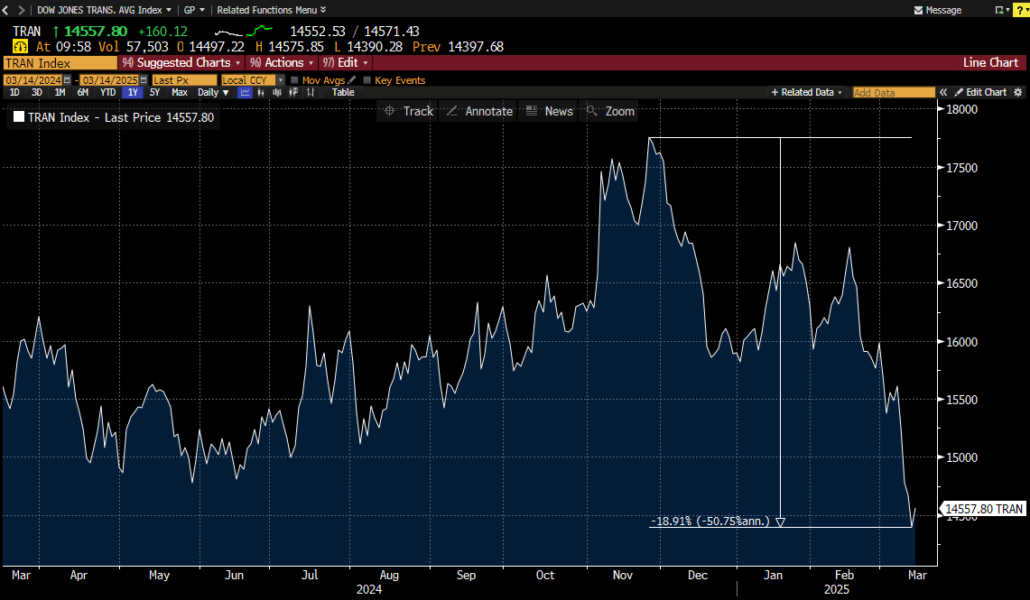
Why present this? Well it looks to us like the Transportation Index, TRAN Index, is breaking down. Despite today’s bounce, it is approaching the “Bear market threshold” of being down 20% from recent highs.
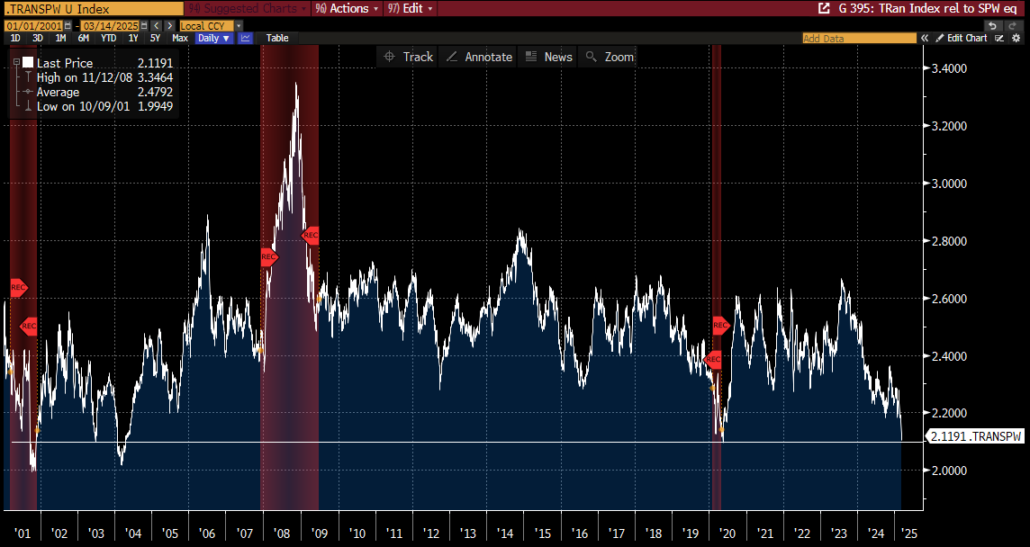
Looking at the same index relative to the equal weighted SPX, the SPW Index, it appears as if it is approaching a dangerous level. We choose the equal weighted index to try and minimize the magnificent 7 impact.
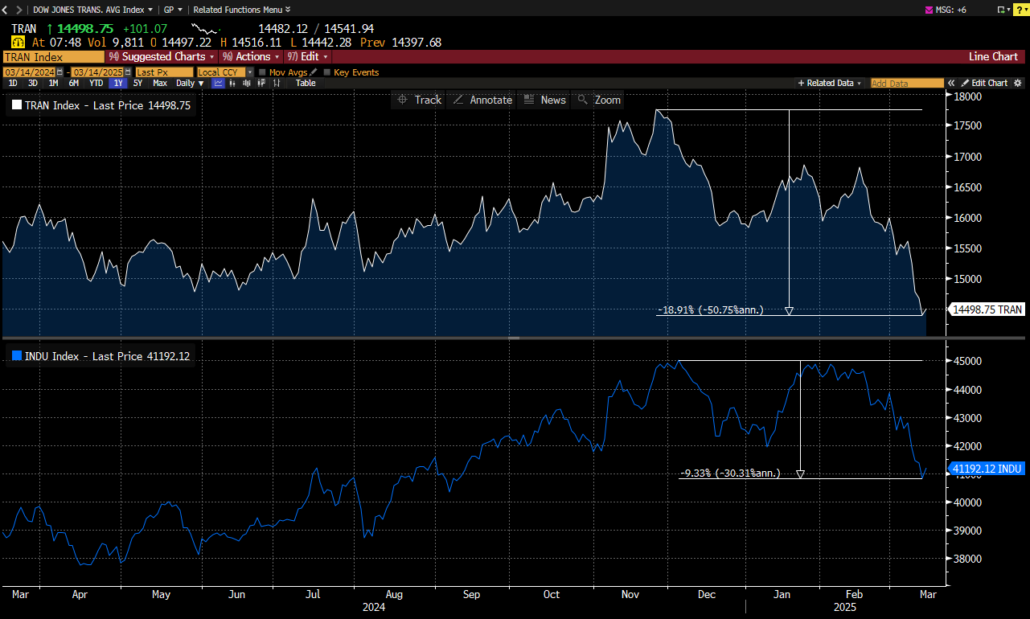
Back to the strict definition of the theory from above, the below chart shows that the DJ Industrial Index is following suit of the TRAN index.
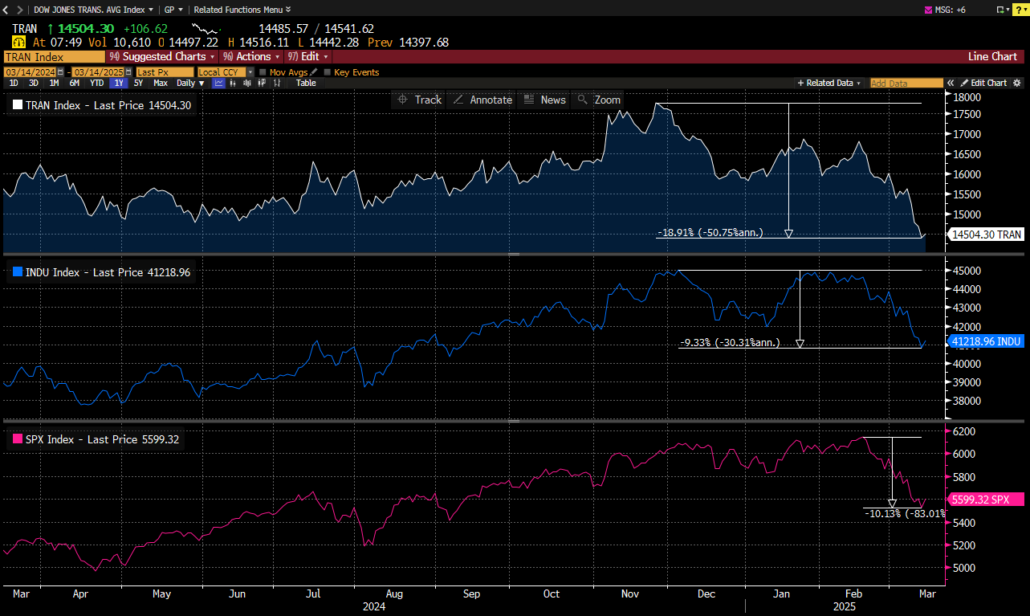
Now adding the SPX Index, which is the more common barometer for the broader market, and it is also moving right in line with the Industrial Index.
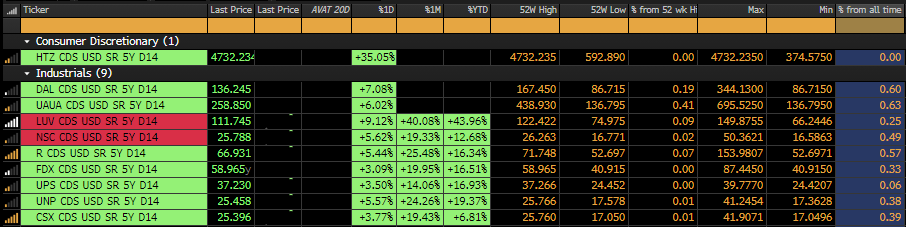
Now, there are some that could make the argument that the Transport Index does not carry the impact significance it has carried in past economic cycles. Not for us to opine on, but we would like to point something out that is similar to what we mentioned last week about corporate spreads starting to widen out a bit, but this time the focus is on CDS. We put together the largest members of each index that have similar Credit Default Swaps openly trading. Is it possible bond holders of some of the most prominent companies in the country are becoming cautious on their outlooks?
TRAN Index
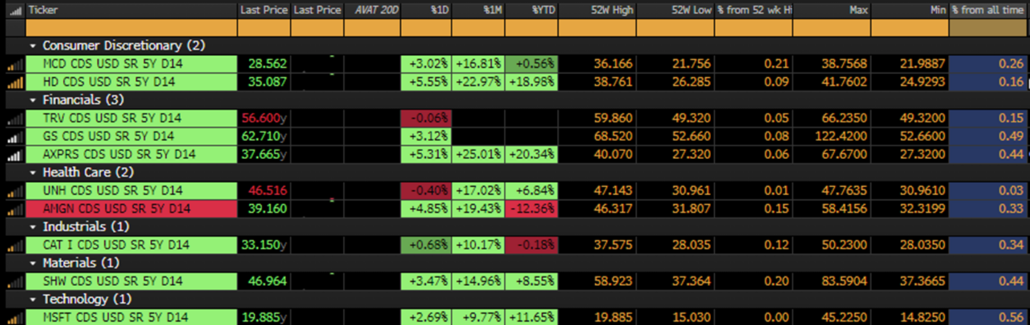
INDU Index
The 4th column from the left in both matrixes show the % that the CDS is trading away from its 52-week high. The farthest left column offers the % from its all-time high. 8 of the 10 names in the TRAN Index CDS are trading within 10% of their 52-week highs, while 2 of the 10 are within 10% of their all time CDS highs.
With respect to the Dow Jones Industrial Index, 6 of the 10 names are trading within 10% of their 52-week highs, while only 1 name is within 10% of its all-time high.
So, what is the takeaway here, like the corporate spread point last week, the absolute levels are not threatening in the grand scheme of things, but the delta on the moves in CDS relative to their 52-week performance is notable, especially within the Transportation Index. From a very simplistic point of view, it is hard to see the economy improving if the companies that move goods are not fairing too well.
Revisiting Employment metrics:
Bank of America published a chart this week we thought looked familiar.
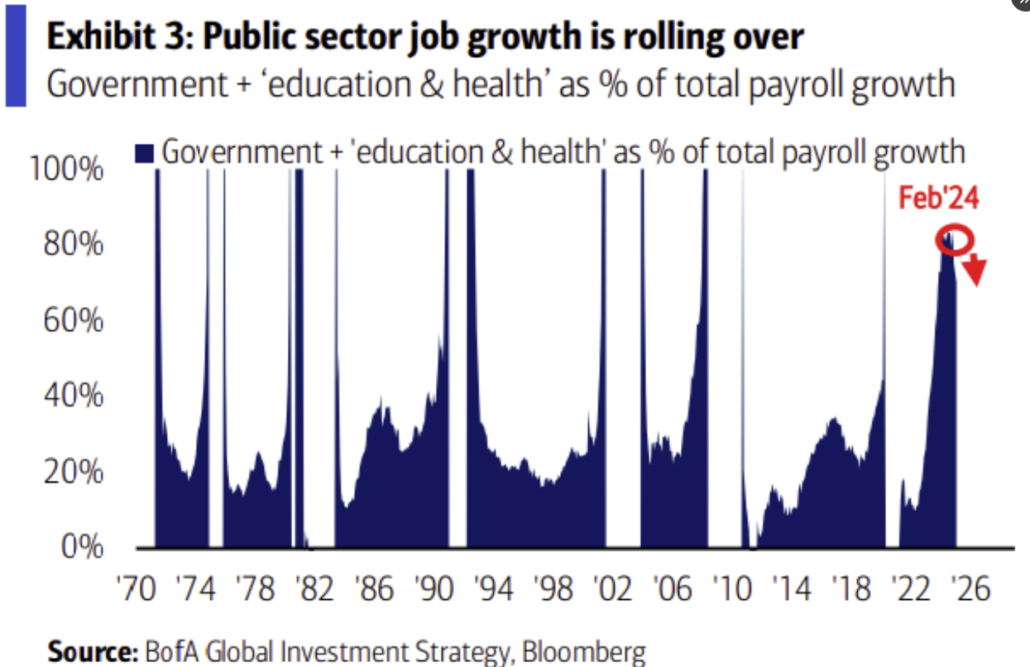
It was published with this commentary:
“One year ago, 85% of US job market growth was in government and sectors dependent on government spending like health and education.”
“The global handoff from big government to the free market may prove slippery, but it seems necessary given large deficits and bloated debt burdens. Economic growth has been enabled by unsustainable government upport and protectionist policies.
It may take time for private sector job growth to accelerate, for government workers to resettle, for broad-based corporate profits to rise, and for global trade to find a new equilibrium. In our view, the likely productivity gains from a market-based economic reboot are greater than risks; and the risks from the unsustainable status quo of debt-financed, tepid, and narrow economic growth are severe.”
– Jared Woodard, BofA Global Research, March 12, 2025
We agree, and for those that might remember, we offered some charts a few weeks back suggesting the same point.
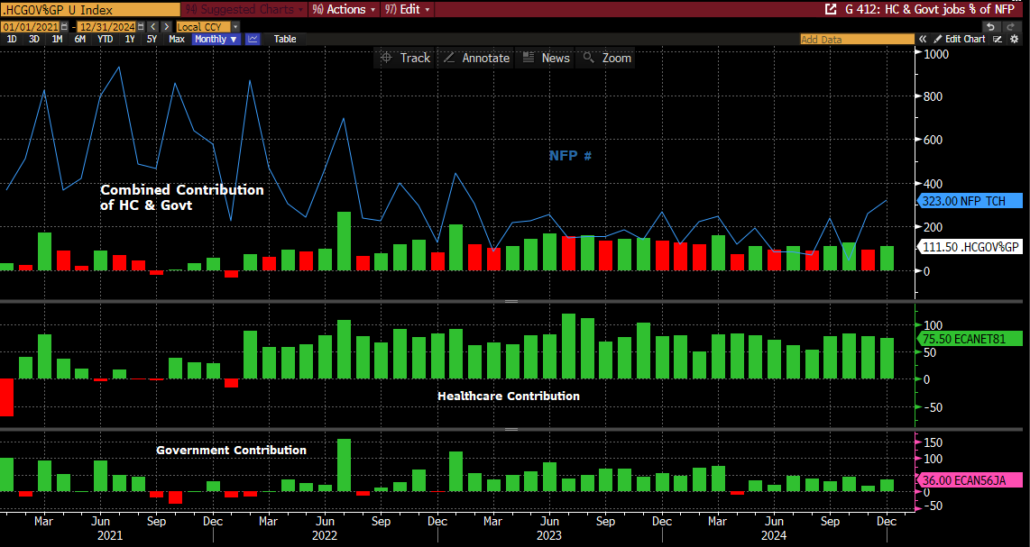
The above shows the % of Government job contribution as well as Healthcare and Education to the overall Non-Farm Payroll number. The simple point is if Government jobs will be trending lower as well as Health Care and Education, as a casualty of reduced Government spending, then the NFP may be in for some rough sailing going forward.
Next Week:
Next week eleven central banks have rate calls: FOMC, BoE, BoJ, Brazil, Swiss SNB, Sweden Riskbank, Iceland, Indonesia, South Africa, Taiwan and Chile
Other key events next week are:
- Nvidia GTC; Jensen keynote Tues 3/18 at 1pm EST
- China State Council briefing Monday re economic plans
- US macro: ret sales, Empire Mfg, inds prodn, Philly Fed
- US housing data: housing starts, existing homes, NAHB Housing
- UST auction: $13b 20y and $18b 10y TIPS
- EU data: Germany ZEW, Eurozone CPI, UK unemployment
- China Macro: prop px, ret sales, inds prodn, prime rates
- Japan: Aside from BoJ we have CPI, Inds Prodn
- Oppie 35th Annual HCare conference
- Piper 25th Energy Conference
- RBC Opthalmology Conference
- BofA Global Industrials Conference
- Baidu to launch next gen of AI model, Ernie 4.5
- Busiest week of EPS for China (sent separate email)
- US EPS: ACN, NKE, MU, FDX, GIS, LEN, CCL, LULU focus
Have a great weekend!
Best,
Meraki Trading Team
About Meraki Global Advisors
Meraki Global Advisors is a leading outsourced trading firm that eliminates investment managers’ implicit and explicit deadweight loss resulting from inefficient trading desk architectures. With locations in Park City, UT and Hong Kong, Meraki’s best-in-class traders provide conflict-free 24×6 global trading in every asset class, region, and country to hedge funds and asset managers of all sizes. Meraki Global Advisors LLC is a FINRA member and SEC Registered and Meraki Global Advisors (HK) Ltd is licensed and regulated by the Securities & Futures Commission of Hong Kong.
For more information, visit the Meraki Global Advisors website and LinkedIn page
Contact:
Mary McAvey
VP of Business Development

")


