
Home Prices/ China/ Conflicting Charts
Home Prices
In previous pieces we have presented this input of the CPI, the contribution of Shelter. This input accounts for 36.22% of the YoY CPI. The metric has been slowly but steadily moving lower since the Q2 2023.
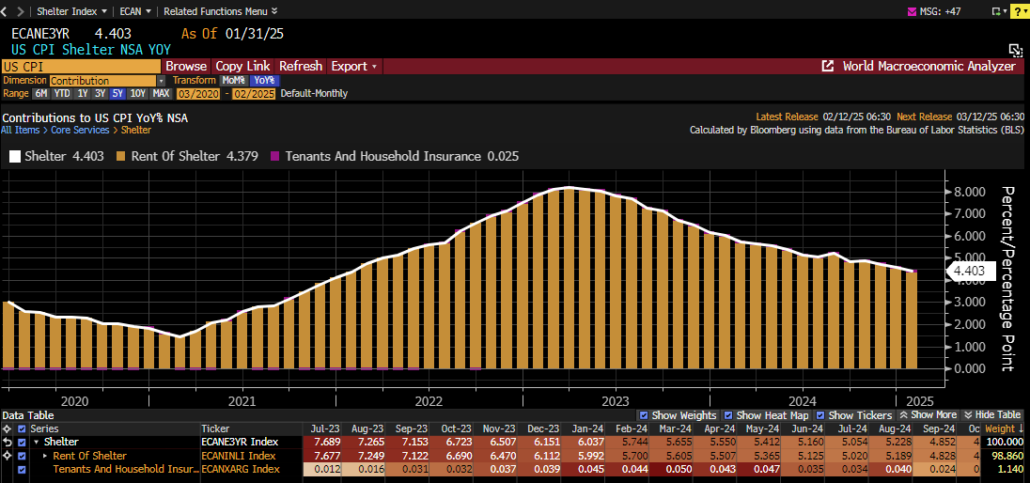
We saw a few charts this week that led us to believe the trend above will continue and possibly accelerate.
New Home inventory is approaching some high-capacity levels.
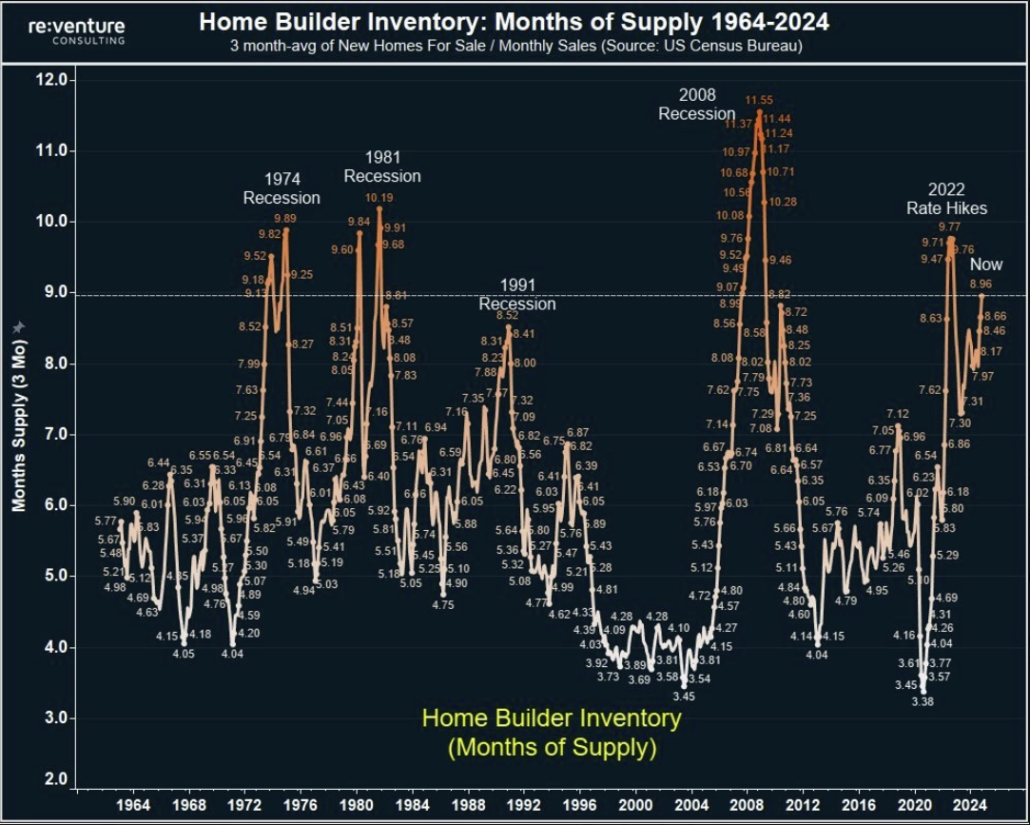
There are now 9 times more new homes for sale than the average number of homes sold per month, the highest since 2022, per Reventure. In other words, it would take 9 months for current inventory of new homes on the market to sell given the current sales pace. This ratio is more than 2 TIMES higher than in 2020. In the past, there were only 4 periods when months of supply were higher than they are now with 3 of them being during recessions. Meanwhile, the number of new single-family homes for sale has risen to 494,000, the highest since the 2008 Financial Crisis. Such a large imbalance suggests price cuts may be coming.
On the rental side we noticed this chart.
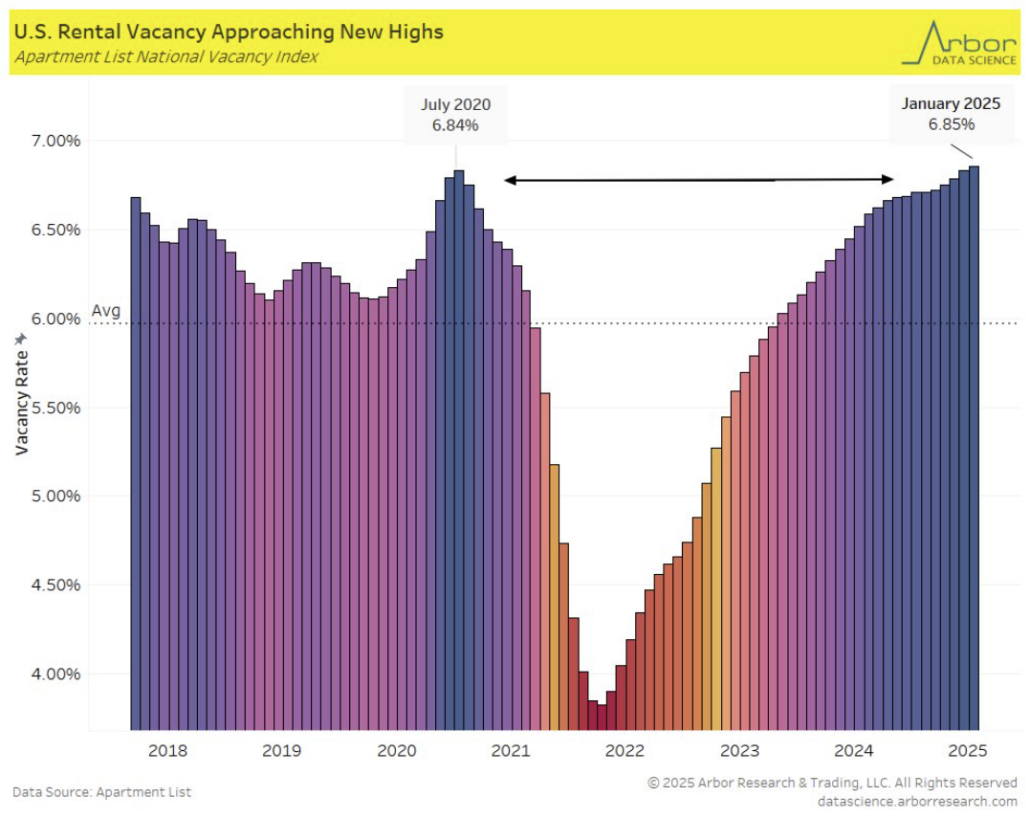
US rental vacancy rate from ApartmentList has now surpassed July 2020 peak, as of January, now up to 6.85%.
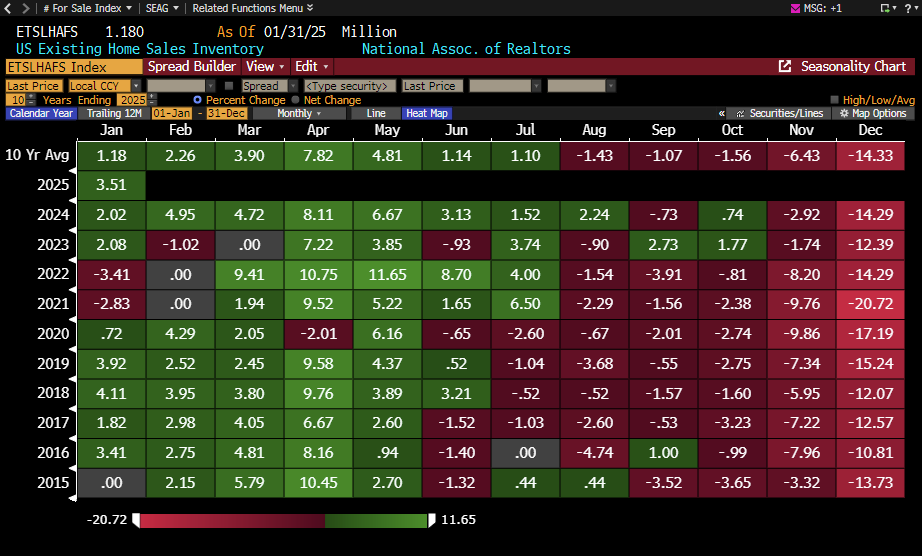
The 2 charts above inspired us to look at the Existing Home Inventory. As many know, there is a definite seasonality to the existing home selling process, so wanted to look at the growth in inventory on that seasonal basis. Turns out the inventory grew in January the most it has since 2019, pre pandemic.
One Housing specialist we follow suggests the delta on home price increases has gone negative as well.
“Home price appreciation was about 4% to end 2024. It’s closer to 2% now nationally. Lots of local markets are negative YoY.”
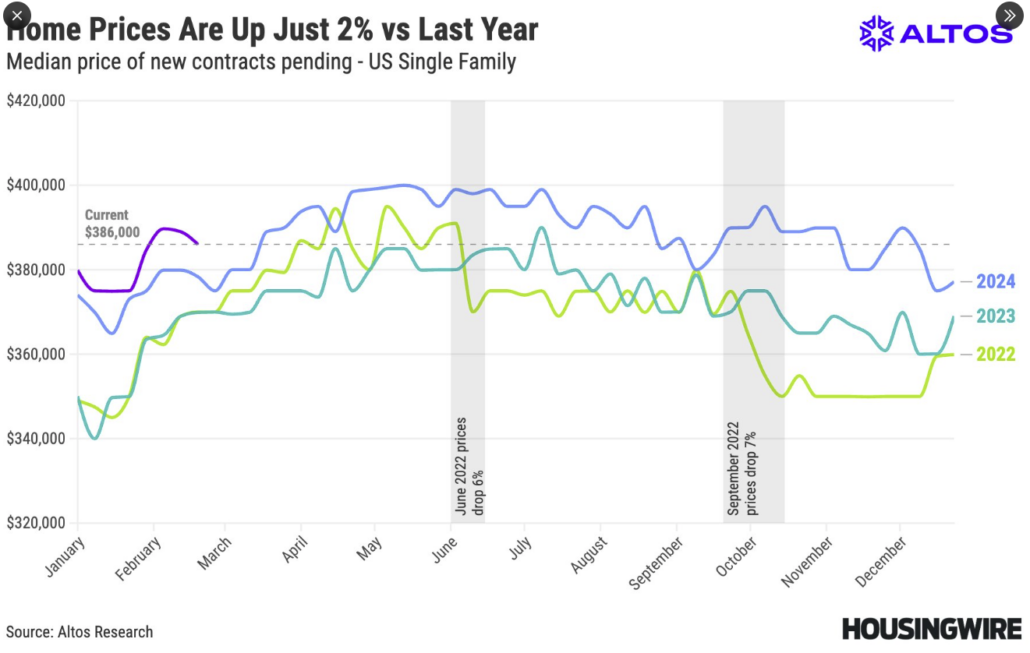
The 4 preceding examples would seem to indicate that the first chart above will at the very least continue its present trajectory lower, and if more than 1/3 of the CPI input continues with a negative delta, we think it will be pretty tough for the CPI to surprise to the upside in the near future.
China
This past week there has been a bit of a focus on Chinese related equities. Recent 13F filings revealed that more than a few funds have been increasing their exposure to China. Then we saw this headline on Bloomberg:
“Morgan Stanley strategists have turned optimistic on Chinese stocks, recommending an equal weight position and predicting the MSCI China Index to reach 77 by the end of 2025. The strategists cite a “structural regime shift” in China’s equity market, driven by technological breakthroughs, regulatory shifts, and efforts by companies to boost share value. The upgrade follows similar bullish views from other Wall Street firms, including Goldman Sachs, JPMorgan Chase, and UBS, and suggests a fundamental shift in how global investors approach the Chinese market. Lombard Odier Investment Managers has increased its overweight position in Chinese stocks this year, betting on the country’s successful transition into a new economy focused on high-value tech.” -BBG
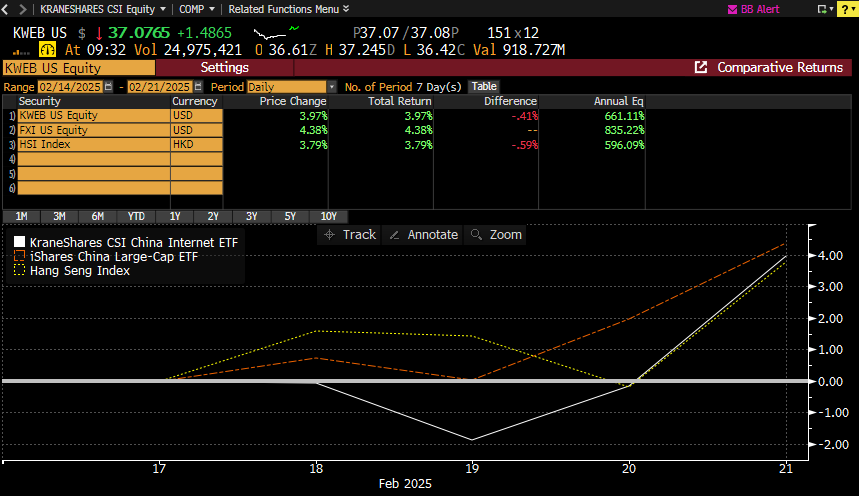
The HSI Index closed up 3.8% this week alone.
Considering the filings, the Bloomberg headline made us wonder if this was simply the sell side following the buyside? Tough to say, wouldn’t be the first time.
But then we came across this chart:
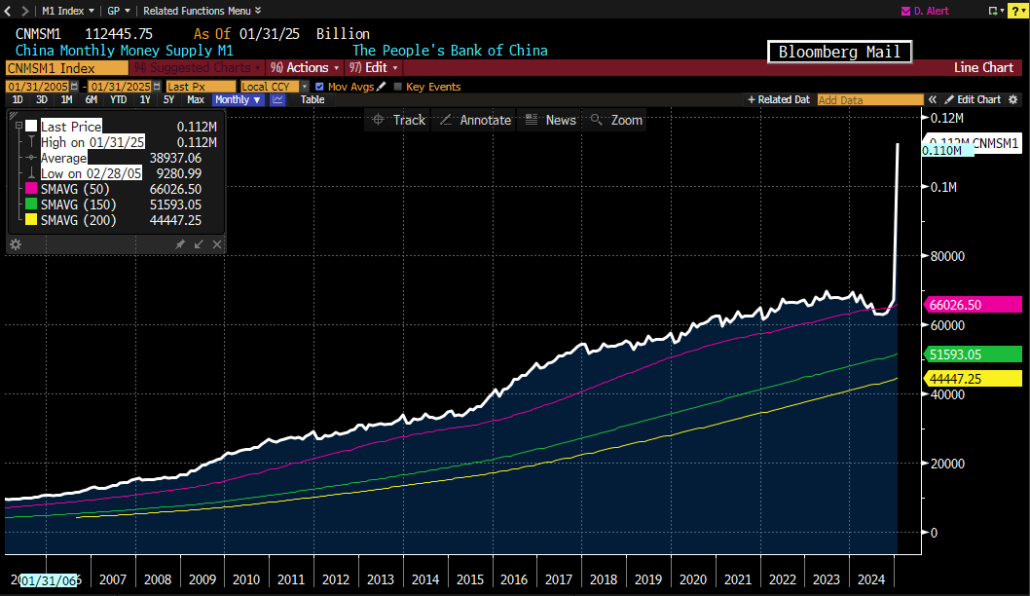
Chinese Money supply. Powerful move!
This might explain the moves better than positioning or sell side upgrades?
We were curious about the correlation. Appears it is strongest with the CSI 300, SHSZ300 Index, at .916.
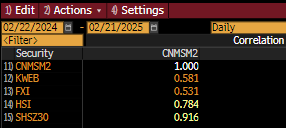
If the .916 correlation holds, should we expect a multiple re-rating on the CSI 300?
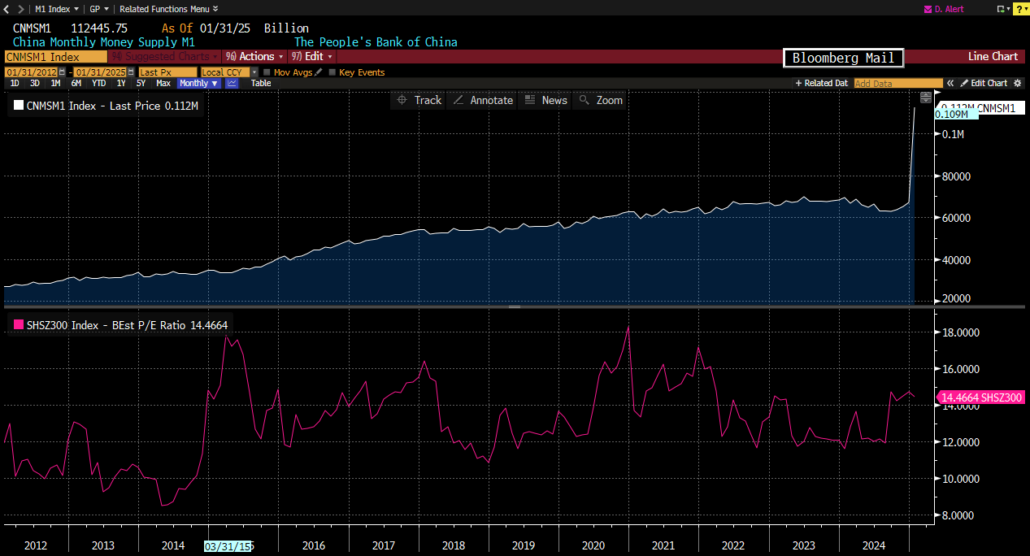
Too many variables to know for sure, but we don’t think it would come as a surprise if the multiple were to elevate toward 16, considering the chart above.
Conflicting Charts
A couple of charts we found somewhat conflicting.
According to the BAML Fund Manager survey, Investors see US Equities as overvalued.
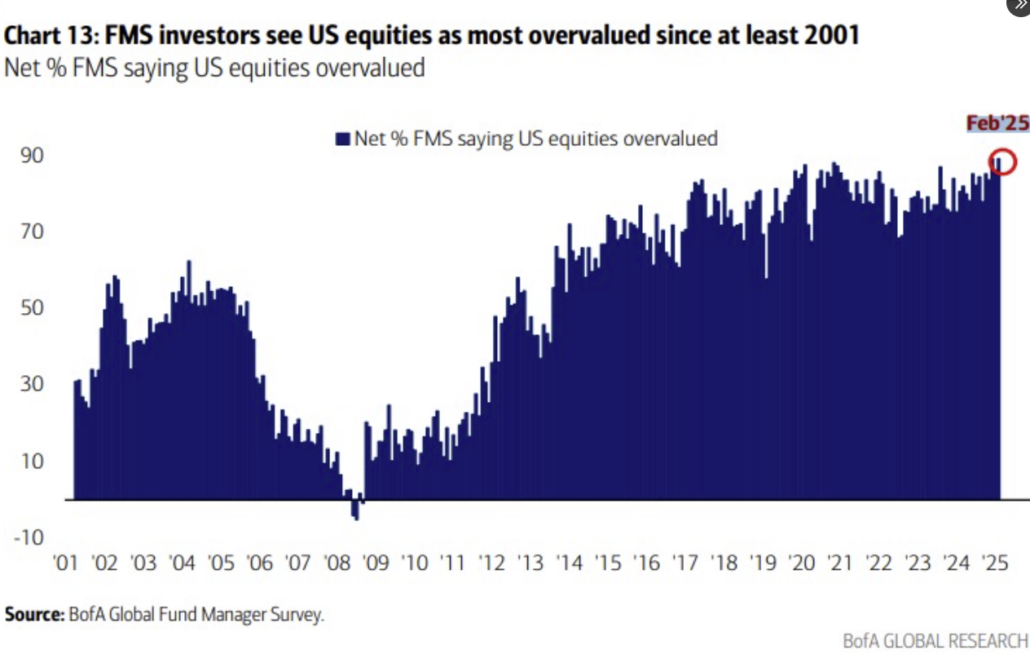
89% of Fund managers now believe U.S Equities are overvalued. That is the most since the Dot Com bubble.
But then there is this statistic. Should the S&P 500 finish February higher, that would mean stocks gained in both Jan and Feb. Rest of year? Higher 93.1% of the time and up 12.3% on avg. Full year up nearly 20% on avg.
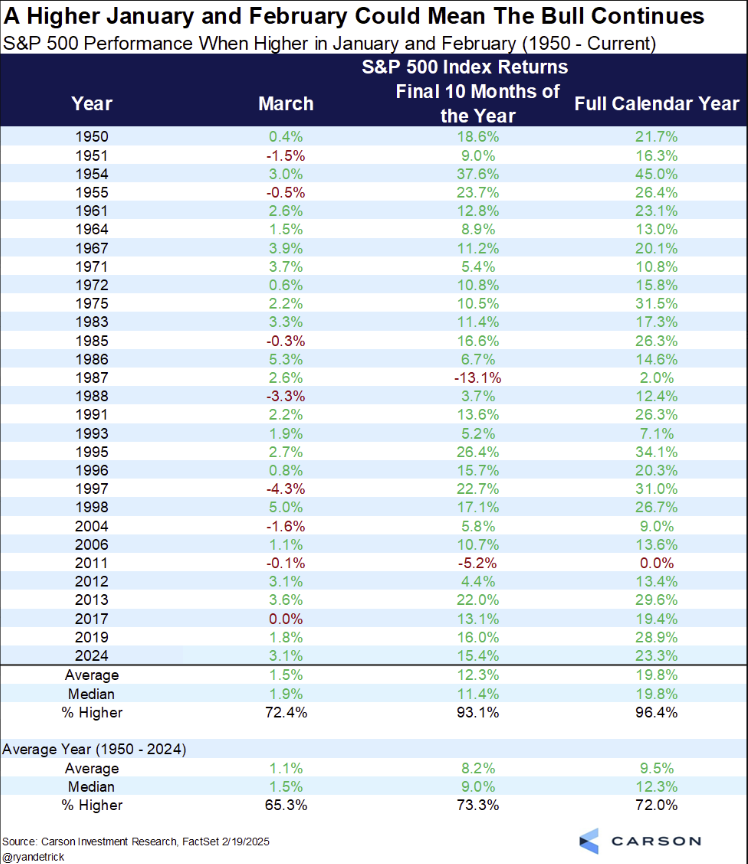
Hmmmmm…..
Have a great long weekend!
Best,
Meraki Trading Team
About Meraki Global Advisors
Meraki Global Advisors is a leading outsourced trading firm that eliminates investment managers’ implicit and explicit deadweight loss resulting from inefficient trading desk architectures. With locations in Park City, UT and Hong Kong, Meraki’s best-in-class traders provide conflict-free 24×6 global trading in every asset class, region, and country to hedge funds and asset managers of all sizes. Meraki Global Advisors LLC is a FINRA member and SEC Registered and Meraki Global Advisors (HK) Ltd is licensed and regulated by the Securities & Futures Commission of Hong Kong.
For more information, visit the Meraki Global Advisors website and LinkedIn page
Contact:
Mary McAvey
VP of Business Development


